The SanDisk X400 1TB SSD Review
by Billy Tallis on May 6, 2016 9:00 AM ESTPerformance Consistency
Our performance consistency test explores the extent to which a drive can reliably sustain performance during a long-duration random write test. Specifications for consumer drives typically list peak performance numbers only attainable in ideal conditions. The performance in a worst-case scenario can be drastically different as over the course of a long test, as drives can run out of spare area and have to start performing garbage collection as well as sometimes even reach power or thermal limits.
In addition to an overall decline in performance, a long test can show patterns in how performance varies on shorter timescales. Some drives will exhibit very little variance in performance from second to second, while others will show massive drops in performance during each garbage collection cycle but otherwise maintain good performance, and others show constantly wide variance. If a drive periodically slows to hard drive levels of performance, it may feel slow to use even if its overall average performance is very high.
To maximally stress the drive's controller and force it to perform garbage collection and wear leveling, this test conducts 4kB random writes with a queue depth of 32. The drive is filled before the start of the test, and the test duration is one hour. Any spare area will be exhausted early in the test and by the end of the hour even the largest drives with the most overprovisioning will have reached a steady state. We use the last 400 seconds of the test to score the drive both on steady-state average writes per second and on its performance divided by the standard deviation.
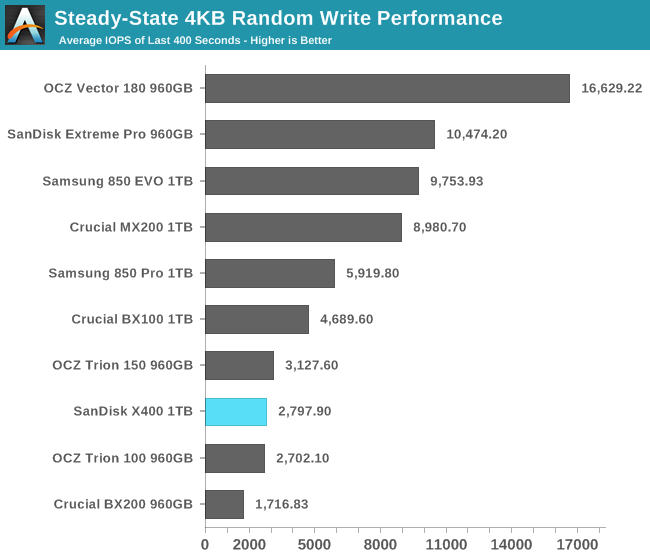
The X400's steady-state write performance is unimpressive but typical for planar TLC drives.
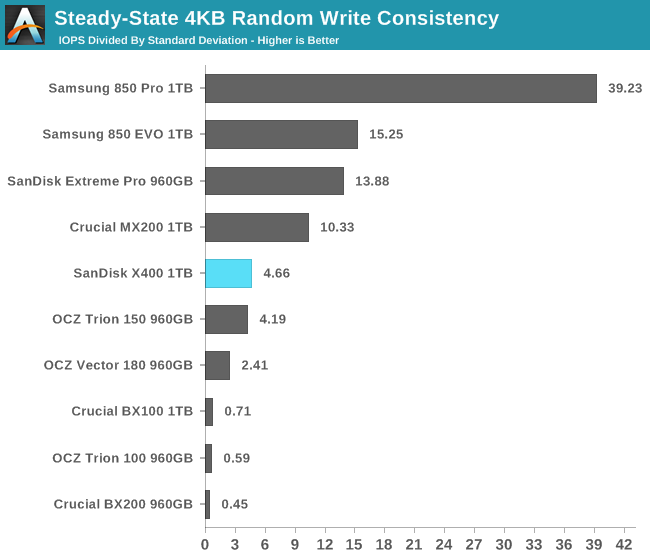
The consistency score of the X400 is good but not great, and it is again close to the OCZ Trion 150.
 |
|||||||||
| Default | |||||||||
| 25% Over-Provisioning | |||||||||
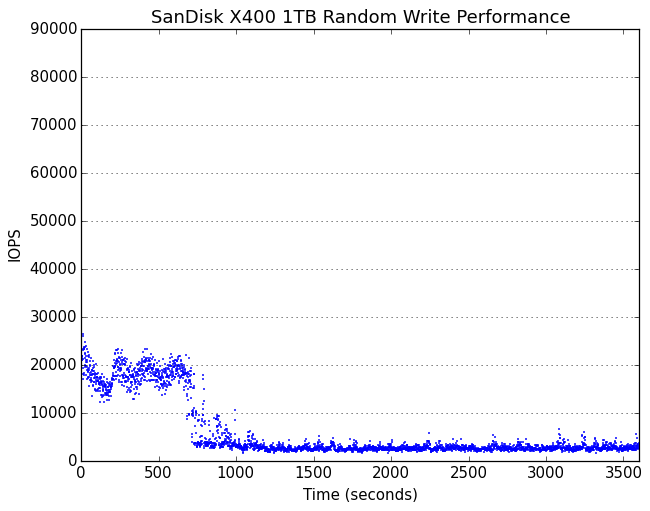
The X400 does not display an initial burst of extreme performance and instead wobbles around 20k IOPS before dropping down to steady state. The X400 does not exhibit severe stalling at any stage of the test, whereas the previously reviewed Trion 150 handles the transition to steady state poorly.
 |
|||||||||
| Default | |||||||||
| 25% Over-Provisioning | |||||||||
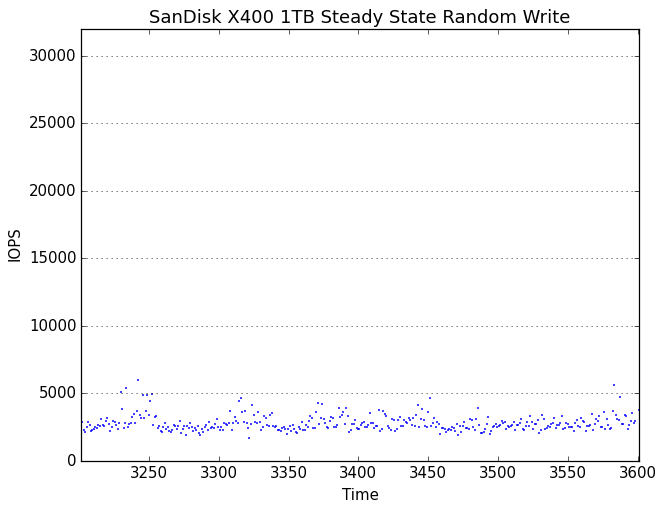
In steady-state the X400's performance is not tightly regulated but doesn't have any outliers of significantly below-average performance. Extra overprovisioning does little to improve the worst-case performance but greatly increases the average and best-case write performance.


41 Comments
View All Comments
Michael Bay - Saturday, May 7, 2016 - link
There`s 3.1 down there somewhere too.I`d like to have the source on your percentages though.
Madpacket - Wednesday, May 11, 2016 - link
Looks like the 1TB Mushkin Reactor (MKNSSDRE1TB) is still the best value drive to beat. Nice to see TLC drives other than Evo's getting better though.hojnikb - Thursday, June 23, 2016 - link
there is also reactor LT, if you want 512GB.justkar4u - Wednesday, May 11, 2016 - link
@anandtech : Seriously ? You are trying to compare apples to oranges to grapes. You are comparing 3D NAND products with 2D NAND, MLC with TLC type products. Sandisk X400 should be compared with OCZ Trion and Crucial BX series. As you can see X400 is better than Crucial MX in some cases ! Samsung, OCZ vector, crucial MX should not even be there in comparison. With that said, clearly X400 is the winner in TLC segment.nobozos - Thursday, May 12, 2016 - link
It would sure be nice if you could include a graph in some (all?) of your charts that normalizes for cost. Raw performance is nice, but performance/$ is also very useful.Andre74 - Friday, May 27, 2016 - link
What's the deal with referring to "Power" both as W·h, and as W (but commenting on efficiency)?Efficiency would be energy consumed per byte read, for example. Effectiveness could be bytes read per second. Measuring power usage during operation tells you nothing of either efficiency or effectiveness, unless it's calculated as total energy.
BimmerInd - Wednesday, June 1, 2016 - link
"The Reactor is about $25 cheaper but only has a 3-year warranty and less than half the write endurance rating." Is this because of n-cache technique? MLC, TLC factors - Does it not make Mushkin a little better one?Endurance Rating
Mushkin Enhanced Reactor 1TB - 144TB
SanDisk X400 1TB - 320TB
Moreover SanDisk X400 is recommended for OEM unlike Mushkin which is targeted at consumer? Does it make a difference?
hojnikb - Thursday, June 23, 2016 - link
Thats just manufacturer rating. I'm sure unless Mushkin uses the crappiest MLC out there, that it will outlive sandisk x400 in terms of real world endurance.BimmerInd - Friday, June 24, 2016 - link
It says it uses Micron's NAND same as in Crucial's BX100. So which one should I choose?runasroot - Thursday, January 12, 2017 - link
I have a question: I know it states that it is 1024gb but is it a true 1024 or is it like something 960gb? I'm cloning a desktop with clonezilla and I need a 1tb ssd that is larger that 960GB to clone from disk to disk. <a href="https://wander.io">Wander</a>