The Quiz on CPU 0: Playing Scheduler Wars with AMD’s Threadripper 2990WX
by Ian Cutress on October 25, 2018 10:15 AM EST
One of the telling conclusions from our original 32-core AMD Ryzen Threadripper 2990WX review was that because of the arrangement of cores and memory, performance in most applications did not scale from the 16-core, and in some cases regressed. Due to a series of discussions, one potential culprit could be the fact that Windows scheduler seems to prioritize CPU 0 over everything else. We did some testing.
Going After CPU 0
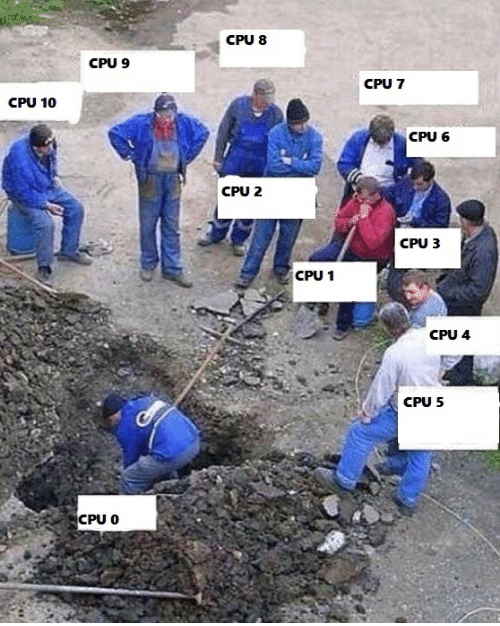
There have been many memes surrounding how most systems prioritize CPU 0: when a program is started, unless it gets moved away, starts on a single CPU core. For applications, like some games, where one thread does most of the work, this leads to a very active CPU 0.

Up until fairly recently, most home systems that had 2-8 cores were in the position where all the cores could be treated exactly the same – they had the same characteristics, the same main memory latency, and the same access to all the resources in the system as any other core. Over time, initially with dual socket systems for the early adopters, but now with processors like Threadripper, not all resources are created equal. In order to get the most of the system, it relies on having a dedicated scheduler to understand the resources available and distribute work accordingly.
There are two main types of schedulers: hardware and software.
The easiest representation of a hardware scheduler is on a graphics card: the latest NVIDIA GPU, for example, has a few dozen identical high-level ‘SMX cores’ that are all identical and the scheduler will dispatch work across some or all of those SMX cores depending on what is required. This works best when all is equal. Modern hardware schedulers can also now run different sets of work across the same GPU, to make things complicated.
Software schedulers are the remit of the operating system. The hardware can inject a topology map into the OS for it to understand where the resources in the system are, but the software is going to manage which threads are on which cores, and priority each thread has. If the OS understands how the memory resources are distributed, it can also allocate where the memory goes and line up threads in relation to where the data is stored for best performance.
For years, most home personal computers have been using Windows, which did not take any cues from the hardware on resource management, making the OS scheduler very simple as almost every device had a homogeneous resource deployment. Linux, on the other hand, has been dealing with heterogeneous resource deployments for a long, long time. Most of the popular distributions are aware of core resources and memory access, due to how Linux plays in multi-socket servers or even smartphones with big.little cores. There have been lots of software forks on how these schedulers should work, with lots of ideas. The key thing here is that out-of-the-box Linux seems to be ahead of the base consumer versions of Windows, which is why to a certain extent websites such as Phoronix have seen better scaling on Linux over Windows.
It was that review from Phoronix that was widely shared around the time of the launch of the 32-core AMD Ryzen Threadripper 2 family, and most users pointed to the scheduler as the issue. Since then, we have seen that a combination of AGESA and Windows updates means that Windows seems to have a better understanding of resources, even just a little:
In discussing some of these issues with Wendell from the YouTube channel Level1Techs, he found that certain benchmark software would get a large improvement if the process affinity for the test meant that it could never touch ‘CPU 0’, or the first enumerated core on the processor. In simple terms, each thread was being initiated on CPU0 and then thrown onto a different core, causing slowdown, but it meant that management also occurred through CPU0.
There are ways around this, mostly scheduler based. The map of resources that the Linux kernel takes from the hardware for a 2990WX looks something like this:
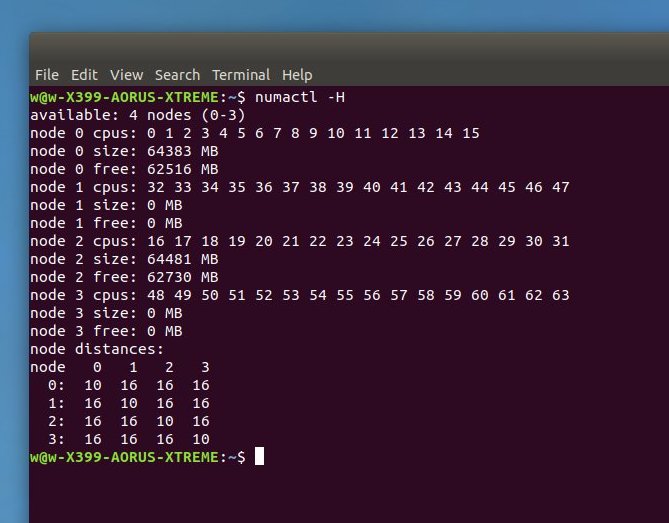
What makes the 2990WX complex is that each node has several different memory latencies:
- Primary nodes 0 and 2 have two latencies: to their own memory (10) and to the memory on the other primary node (16).
- Secondary nodes 1 and 3 have one latency, to memory on either primary node (16).
Not only is there core-to-memory latency, but also core-to-core. I have maps of these and it all gets complex very fast, but there are some trends at least, given that the 2990WX is at least symmetric at some level.
The point being, there is a rough map of weights that Linux (and Windows, if it wanted) can use provided by the processor. However, as threads are dispatched and cores fill up, it is up to the software scheduler to adjust the weighting of which cores have the best resources. If that map is not updated, then for every binary that is executed, it gets dumped on CPU0 as that core is the first enumated core with the best resources. It is only when the OS realises those resources are slow that the thread will migrate, or if the scheduler is smart, it might migrate in advance. But the map of what cores have access to what resources needs to be a dynamic map, and the OS needs to keep track of it all (which might take up CPU 0 in the process!).
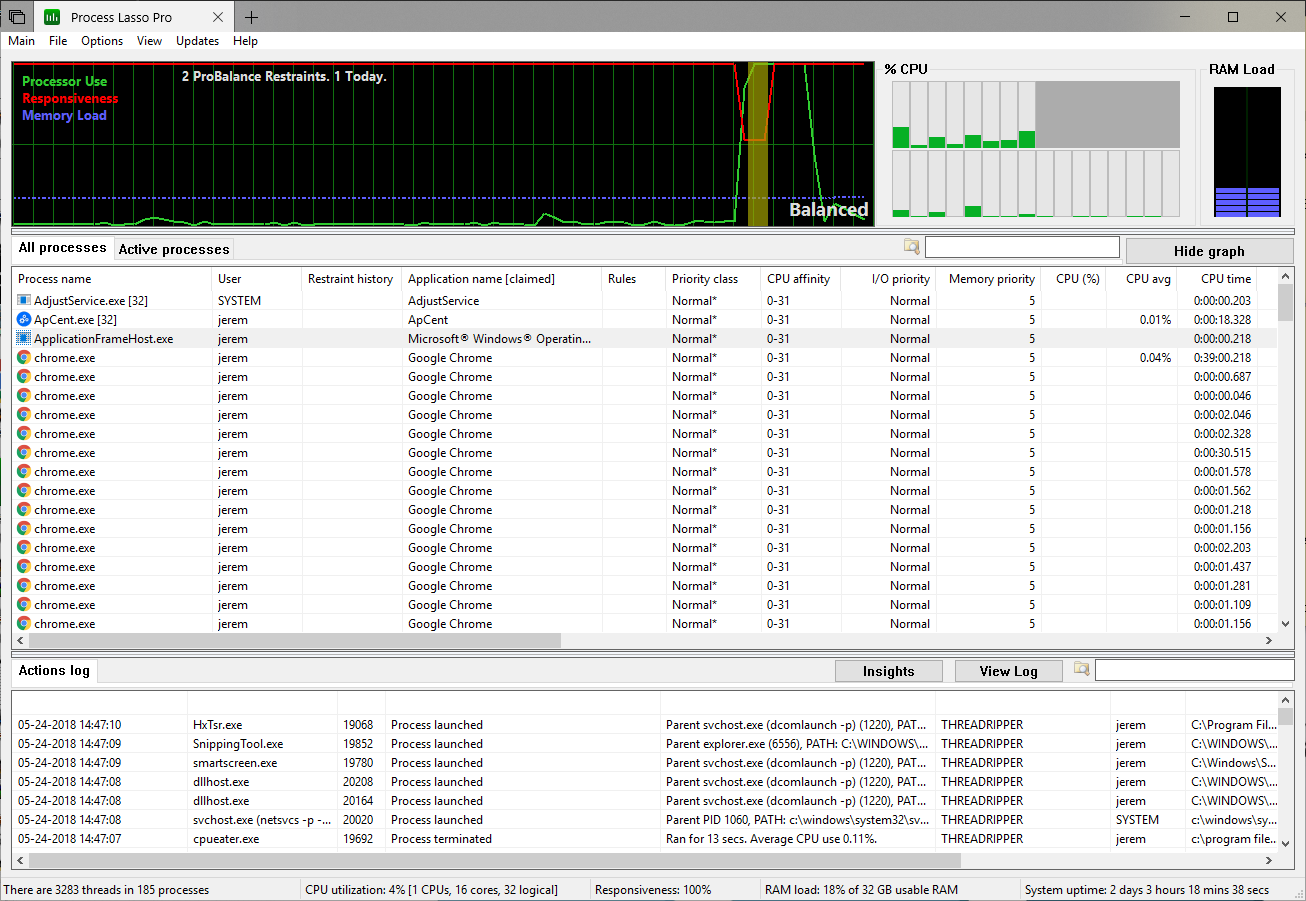
In Wendell’s video, he showed the Indigo benchmark jumping up from a score of about 1.6 to 3.0 when he removed permission for the program to use CPU 0. Wendell’s program of choice is called Process Lasso, a nice little utility that does what a scheduler should: keep track of what threads are where and what resources are available.
In this short piece, I wanted to do some testing with our suite. I recently updated our power testing to be affinity based rather than thread based, so it was fairly straightforward to initiate a benchmarking session where none of the software had access to CPU 0. Rather than use extra software to make the change, I did it at the command line level.
Setting Affinity at Command Line in Windows 10
In either a command window or a PowerShell window, users may know of the ‘start’ command. It’s a useful tool – it allows users to run software asynchronously, or with the /wait flag, can be used to fence certain commands until they complete. The start command also has another useful flag, /affinity.
- Start /affinity [mask] “” [executable]
- Start /wait /affinity [mask] “” [executable]
The way to call the affinity method is a little different to what I initially expected when I read the details for the command. It requires an ‘affinity mask’ which is a hexadecimal representation of which cores are to be enabled.
A mask in this case is not the same as simply stating how many threads you want. With the mask, you can say exactly which cores can be accessed and which cannot. A simple way to do this would be in binary with an 8-core CPU:
- 00000001 = CPU 0 only active
- 00101010 = CPU 1, CPU 3, and CPU 5 active
- 10001100 = CPU 2, CPU 3, and CPU 7 active
- 11111110 = All Cores except CPU 0
(note, we start counting from 0, so the cores are listed as 0 to 7)
In order for this mask to be applied, the binary needs to be converted to hexadecimal:
- 00000001 in binary = 1 in hexadecimal
- 00101010 in binary = 2A in hexadecimal
- 10001100 in binary = 8C in hexadecimal
- 11111110 in binary = FE in hexadecimal
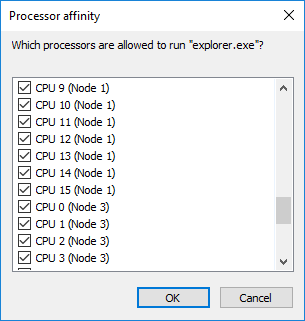
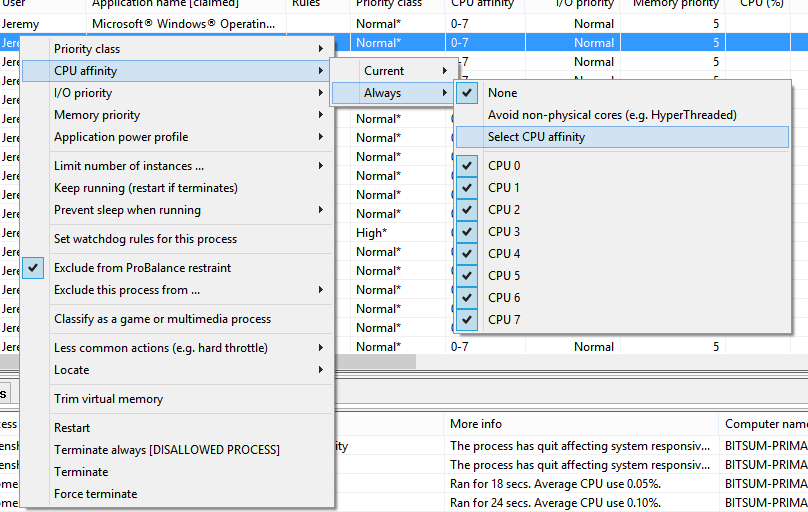
This is easy for 8 cores. For 2990WX, we need to move up to 32 cores – at least, that is what I thought. When we first reviewed Threadripper 2, Windows did see 32 cores as equal. Since then, as shown in the image below, it now separates the cores into nodes, but more than that, it also sees 16 CPUs per node, which means that every thread is also listed when Simultaneous Multithreading (SMT) is applied. This means we need to have a mask for 64 threads. The full binary mask is:
- 11 1111 1111 1111 1111 1111 1111 1111 1111 1111 1111 1111 1111 1111 111 1100
This enables all 64 threads except for the last two. If we convert this into hexadecimal for the command line, it becomes:
- 3FFF FFFF FFFF FFFC
As a result, the full command is now
- start /affinity FFFF FFFF FFFF FFFC “” “D:\2019\Script.exe”
I have a distinct feeling that when this command was developed, having a few cores was easy to adjust. But with 64 threads to manage, it is a little unwieldy. Next I'll have to try one of Intel's quad-socket 288 thread servers. As for the command, I have no technical explanation as to why those first quotes have to be there, but the command doesn’t work without them. The quotes are required in the command as an empty 'window title'.
There's also the fact that thread affinity in Windows beyond a certain number of cores transitions into a 64-bit number. However, Windows reporting methods for affinity, for some reason, casts the mask to an unsigned 32-bit number, so anyone looking at the records or logs will see negative affinity values. It doesn't seem to affect the operation, but it can be difficult to debug.
Because all of my benchmarks run from a singular script, those benchmarks are spawned from the script, and cannot acquire more resources than the script has access to. This causes some fun issues with some of our software (y-cruncher) that tries to set its own masks, but aside from those one or two points where I had to step in and accept the error to continue, the script processed quite happily.
Removing CPU 0 From The Equation: CPU Power, Frequency, Memory Access
So any process that the Windows own scheduler wants to spawn now has happy free access to CPU 0. However, now it means that if we do a benchmark comparison between a standard run and this affinity mask run, there are a couple of points on power and frequency to mention.
If we take a fully multi-threaded workload, such as POV-Ray, then we are comparing 64 threads against 62 threads, so there will be a 3% decrease in threads available for the results. But more than that, the power of the chip is now split between fewer cores, so it is possible that the remaining cores could run at higher frequency. We compared our PoV-Ray loading test for power and both settings, at 62 and 64 threads, gave 248 W full package and 191-193W for the cores.
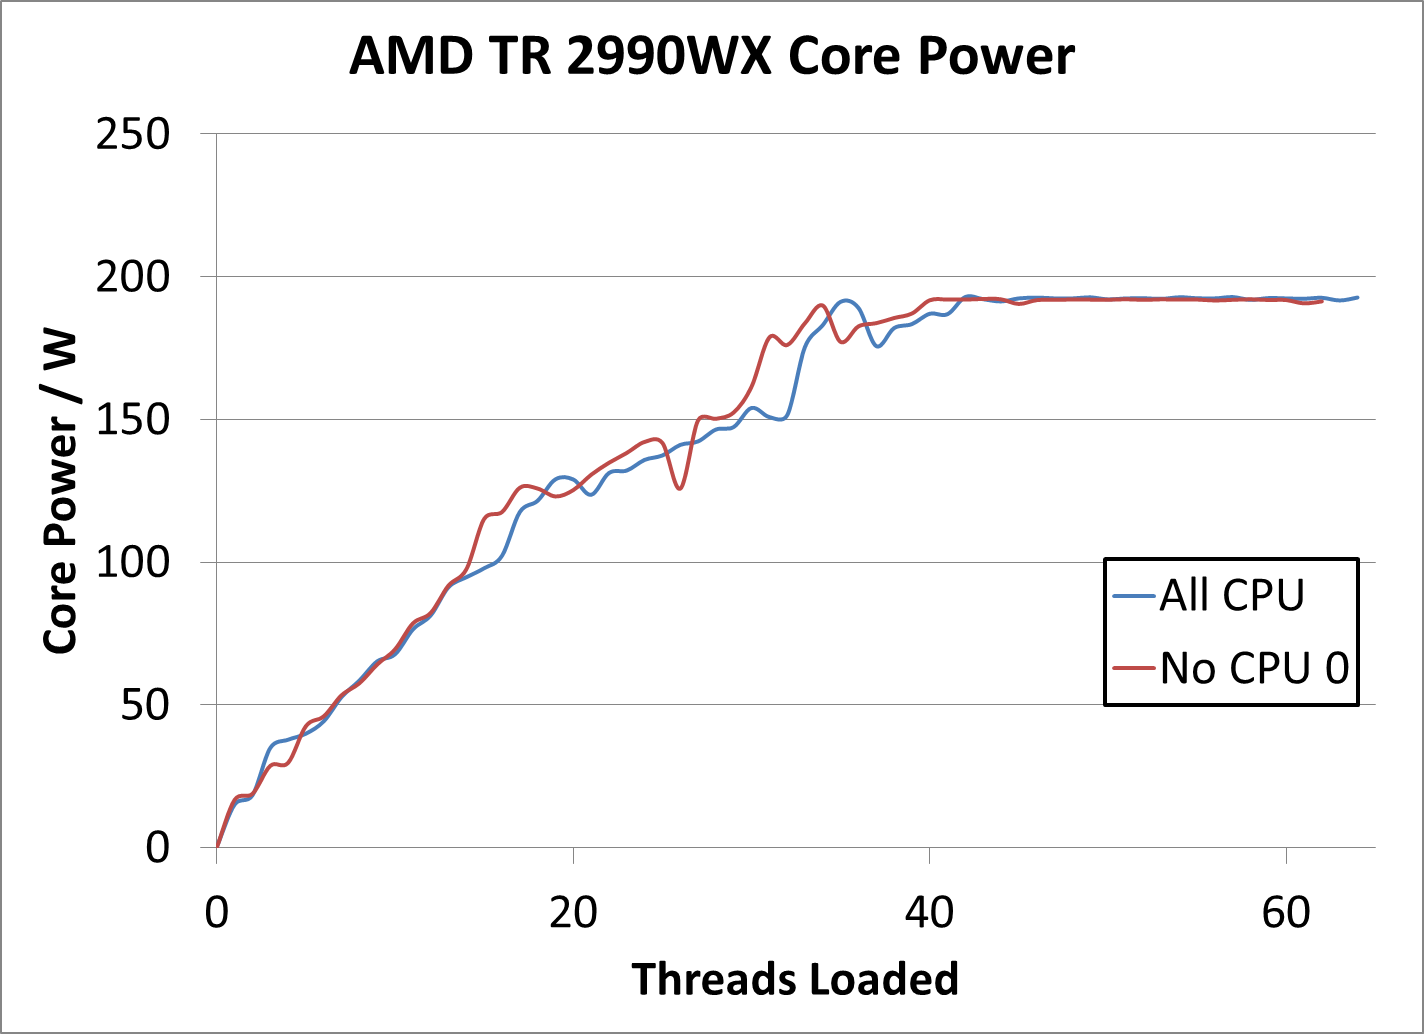
There seems to be the case that in a variable loads, in most cases, the 62-thread model used more power. This is perhaps due to the fact that when it loads up a 8th core, it is already onto the second Zeppelin die, rather than as when it hits the 9th core. By distributing the threads across different dies earlier that it normally would, this can technically give the cores more thermal headroom earlier as well, although core-to-core communication would be slower. This seems to certainly be the case when the chip is half loaded for sure, when it moves onto the secondary nodes.
When it comes to memory access, the key part of these multi-die processors is the latency between cores when every core is trying to talk to each other. This is something a lot of benchmarks might miss, as often there are other bottlenecks. However, in the 62-thread case, one would expect that core-to-core traffic would be quicker, by virtue of having fewer threads talking and less congestion along the infinity fabric. This applies for core-to-memory as well, so there can be some instances where by virtue of running fewer cores, some tests might actually improve in result.
Between the power, the frequency, the thread differential, and the communication congestion, for fully mutti-threaded benchmarks it is going to difficult to pick out exactly why each benchmark might change
Performance Analysis
In our regular CPU reviews, we split our benchmarks into several key areas: web, system, rendering, encoding, office, and legacy. We run a mix of real-world, industry standard, synthetic, and custom benchmarks to get a better spread of the land. In this short analysis, rather than explaining each benchmark, we’ll just post the results and differential, with the overall roundup values being calculated as the geometric mean of the tests. Arrows on the graph show up and down when a 3% difference is observed.
The system used for testing was
- ASUS X399 Zenith Extreme ($537)
- AMD Ryzen Threadripper 2990WX at stock settings ($1749)
- Enermax Liqtech II TR4 liquid cooler ($150)
- G.Skill TridentZ 4x8GB DDR4-2933 14-14-14 ($350)
- Corsair AX860i PSU ($190)
- Sapphire RX 460 2GB ($150)
- Corsair MX200 1TB ($203)
Overall, this system comes north of $3300. Many thanks to each company for the hardware in our test beds. You can follow our affiliate links above to purchase any of the parts, all of which goes a small way to assisting us in our work.
System Benchmarks
Our system tests involve application loading, single-core video analysis, scientific benchmarks, emulation, and 2D-to-3D modelling.
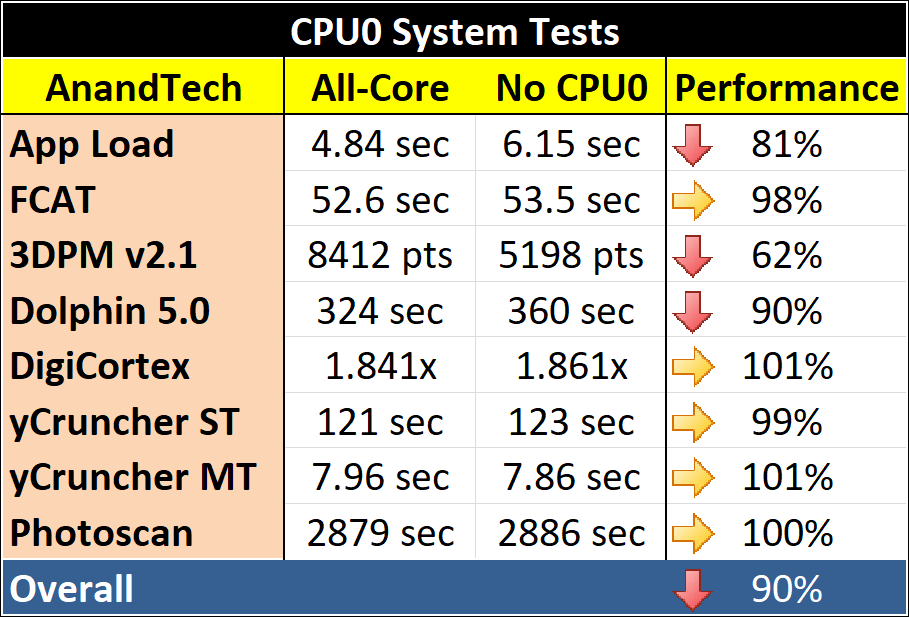
For the most part, the system tests look equal. There’s a slight gain in the DigiCortex test that I would attribute to less traffic with fewer threads, as that benchmark is usually bandwidth and memory driven. The application load benchmark suffered a big loss, perhaps showing that CPU0 is vital to applications actually loading, and the biggest loss was on 3DPM. Given that I wrote 3DPM, I’m not sure what the issue was here – it’s a sizeable defeat, and is meant to scale pretty well with threads, and the threads do not talk to each other. 3DPM is an OpenMP based test, for what it is worth, which might be related.
Web Tests
Our selection of web benchmarks features some old, some new, with the Kraken + Octane being more throughout oriented, while WebXPRT focuses more on presentation with data manipulation.
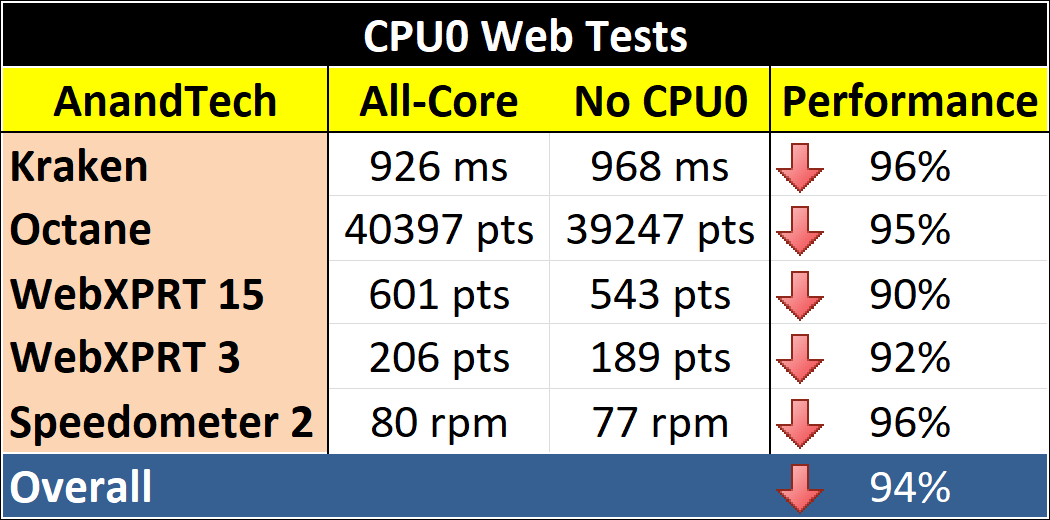
Every web test takes a slight loss, which again seems odd as if CPU0 isn’t available, surely CPU1 is a viable replacement? WebXPRT took an 8-10% hit, which again is odd but points to the importance of CPU0 perhaps.
Render Tests
For our rendering, we use a number of common rendering tools on the market, including some code base testing in LuxMark. If you remember above, this is where it was reported that some gains should be.
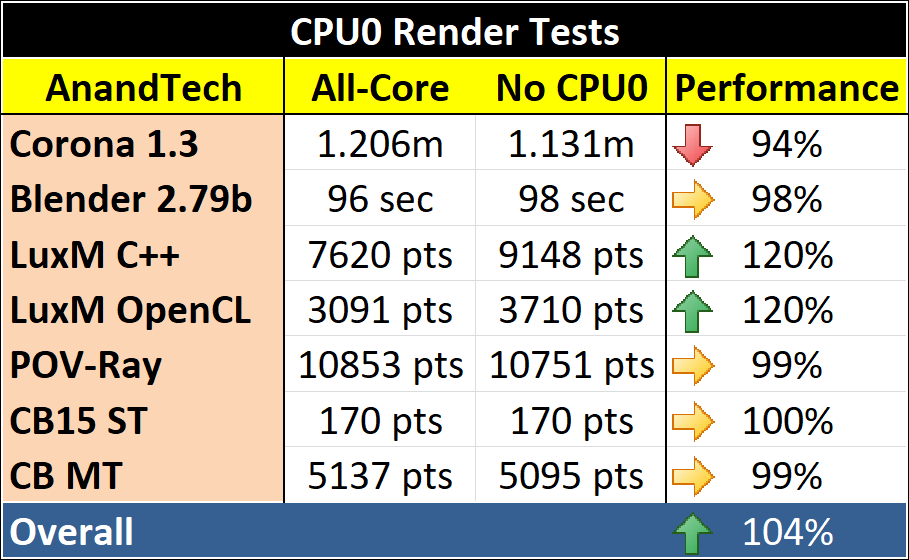
For most benchmarks, the performance was pretty much the same. Corona takes a slight knock, likely due to the fewer threads, but the biggest gains (of the whole testing) were in LuxMark. For both of our C++ and OpenCL tests we saw a +20% performance gain by removing CPU0 from the equation. I have a feeling this is down to how LuxMark is likely coded – to identify CPU nodes and subdivide the work while pinning the memory for those threads near to the cores. This goes in line with the rendering results reported elsewhere.
Encoding Tests
We mix it up a bit with the encoding, looking at both file encoding on several platforms and then video encoding/transcoding into different formats.
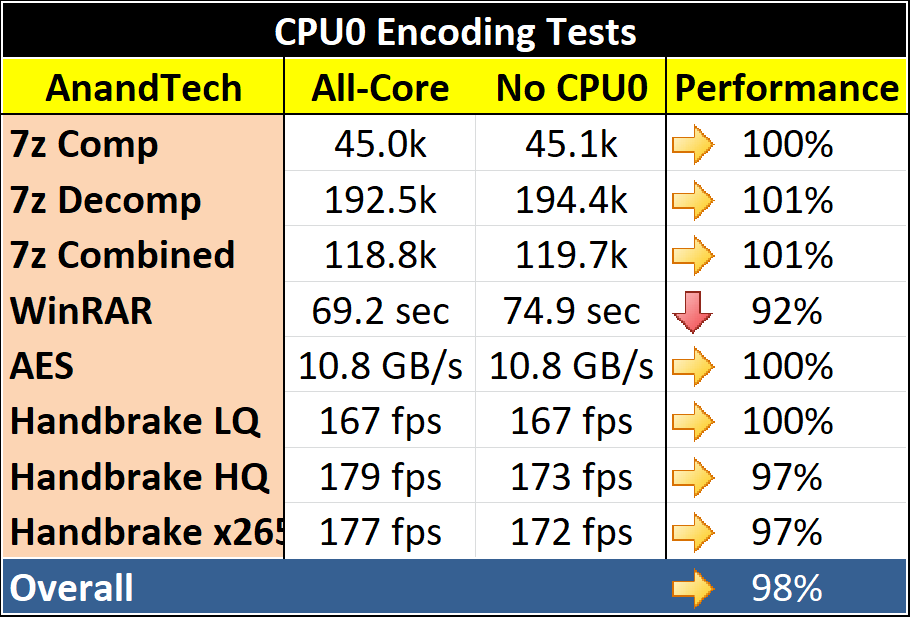
All of our encoding tests were within 3%, although the x265 test on Handbrake was only just, but the biggest deficit was to WinRAR. WinRAR is a variable threaded, memory dependent benchmark, so removing one of the cores attached to a bank of memory would have a hit to a test like this.
Office Tests
For this we have our Chromium Compile test as the headline, following it up with physics simulation on 3DMark and synthetics on GeekBench4.

I’ve removed some of the physiscs tests as they seem to be split between equal or about a 10% loss. The Compile test was more affected, perhaps due to the memory issue similar to WinRAR by losing a core with direct memory access. A surprise is GB4 in multi-threaded mode, where most of the gains are due to the memory subtest (up 18%). This is perhaps were having fewer threads accessing memory lets the ones that are there push through – one would expect an identical result perhaps either way, but it seems work on GB4.
Gaming Tests
We ran through our regular benchmark suite, including all our 720p, 1080p, 1440p, and 4K testing. For the most part, at real world resolutions, there was next ot no change - +/- 3% at most on both average frame rates and 95th percentile values. There was some slight variation at our IGP settings (720p, mostly) however:
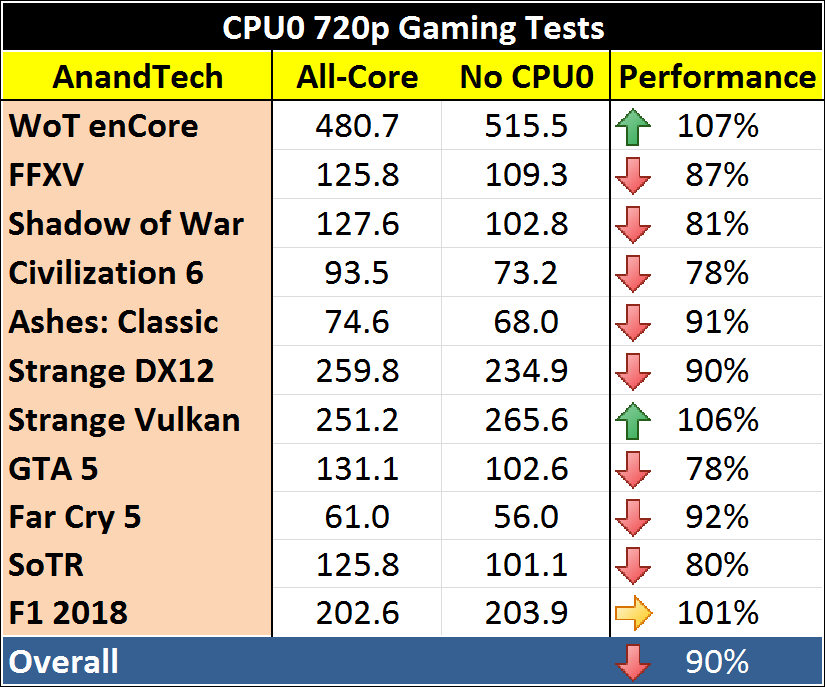
Except for F1 2018, which was neutral, Strange Brigade on Vulkan which improved, and World of Tanks enCore which improved, every other game was categorically a worse performer. The decrease was split between 10 and 20% for almost all the games, which goes to show just how important having a strong CPU0 is.
Overall Thoughts
A good scientist always publishes negative results. That’s what we are taught from a morality standpoint, although academia doesn’t always work that way. In the land of tech publishing, I get to post the results in front of me and explain them. It just so happens that testing for CPU0 wasn’t as much of a hit as some of our initial thoughts led us to believe.
For the most part, the benchmark scores were within a margin of error. CPU0, CPU6, CPU14 – it didn’t matter where the program ended up as long as it still had good access to memory. That being said, a good number of benchmarks saw a 5-10% drop in performance. This underlines perhaps the importance of having the first block of cores, starting with CPU0, as the highest-performing cores with the access to most stuff – when you travel off die but memory is still tied to that first node, there’s a performance hit in play.
The big win was in LuxMark, with both tests getting a cool 20% benefit. This corroborates the Indigo test uplift seen by Wendell, which is perhaps using the same technique in identifying nodes and performance. OpenCL should make this easy - identifying devices by capability and dispatching work accordingly is the best way to use these variable resource topologies effectively.
However on the other side, gaming performance wasn't great. At resolutions people normally play at, 1080p up to 4K, most games were within the error of margin. But at the CPU limited side of the equation, down at 720p with mostly low settings, performance either slightly improved (2 games), or regressed by 10-20% (8 games). The 2990WX isn't really a gaming chip, although one can game on it.
In the end, with most of the results equal though, it is hard to come to a conclusion around schedulers. I like the way that Linux offers a hardware map of resources that software can use, however it also requires programmers to think in those heterogeneous terms – not all cores will always have the same level of access to all the resources. It’s a lot easier to code software if you assume everything is the same, or code the software for a single thread. But when the hardware comes as varied as Threadripper 2 does, those hardware maps need to be updated as workloads are placed on the processor. Unfortunately I’m neither a scheduler expert not a coding expert, but I do know it requires work in both segments.
Regardless of what Intel has been pushing in its press releases recently (if they want to play the high-core count game, they’ll have to jump on board with multi-chip at some point), by the time more multi-chip processors come to market, we’re all going to have to realise that unless every part of the system has equal billing, this is all going to be have to coded in. If it happens at the OS scheduler level, great, but it won’t ever be as simple as it was 10 years ago.
Related Reading
- The AMD Threadripper 2990WX 32-Core and 2950X 16-Core Review
- The MSI MEG X399 Creation Motherboard Review: The New 16-Phase Shark In Town
- The ASUS X399 ROG Zenith Extreme Motherboard Review: Top Tier Threadripper
- The ASRock X399 Professional Gaming Motherboard Review: 10G For All
- The GIGABYTE X399 DESIGNARE EX Motherboard Review


73 Comments
View All Comments
Death666Angel - Saturday, October 27, 2018 - link
Nothing about "performance increase", just "performance".GreenReaper - Monday, October 29, 2018 - link
No, it's a fair point - if you put the arrow it initially looks like "increase of 104%". It might be better to just leave those out and colour the text green or red appropriately.bpkroth - Thursday, October 25, 2018 - link
Just a guess, but possibly interrupt handling is primarily handled on or optimized for CPU0 so some of your more I/O oriented tests might be seeing slowdowns there due the process not already being resident on that core when the OS needs to handle an I/O for it. In Linux you could probably measure that by watching /proc/interrupts during your tests. Not sure offhand what the equivalent would be in Windows.alpha64 - Friday, October 26, 2018 - link
I would like to comment on the second-to-last paragraph:"In the end, with most of the results equal though, it is hard to come to a conclusion around schedulers. I like the way that Linux offers a hardware map of resources that software can use, however it also requires programmers to think in those heterogeneous terms – not all cores will always have the same level of access to all the resources. It’s a lot easier to code software if you assume everything is the same, or code the software for a single thread. But when the hardware comes as varied as Threadripper 2 does, those hardware maps need to be updated as workloads are placed on the processor. Unfortunately I’m neither a scheduler expert not a coding expert, but I do know it requires work in both segments."
I think that this is easy to misunderstand. The Linux scheduler handles mapping of program's threads and/or processes to multiple cores. The "software" that has to be aware of the hardware resources is only the kernel. When a software program is written that has multiple threads of execution (again, whether "threads" or "processes" in the Linux system sense), it needs to know nothing about the hardware resources. The kernel decides what cores to run the software on.
Here is an example:
When compiling the Linux kernel, many different programs are run. Mostly the C compiler (normally GCC, although in some instances clang), and the linker. The C compiler and the Linker do not need to know anything about the hardware configuration. In fact, they are mostly single-threaded programs. However, when the build job is set to run multiple C compiler instances in parallel, the speed of compiling the Linux kernel's multiple thousand source files into a working final product scales quite nicely. You can see this on Phoronix's results of testing the TR2990WX.
Another example:
When running 7zip, it uses multiple threads for its work. 7zip was not optimized for the TR2990WX at all, but scales much better in Linux than on Windows (again, see Phoronix' results). 7zip is simply a multithreaded application. It knows nothing about the resources on the TR2990WX. However, since the kernel and its scheduler know how to properly handle NUMA configurations (like the TR2990WX has), it is able to get a much more reasonable scaling out of the TR2990WX than Windows.
I hope this clarifies things for anyone reading this who finds this paragraph confusing or even misleading.
BikeDude - Friday, October 26, 2018 - link
@alpha64: "The "software" that has to be aware of the hardware resources is only the kernel."How can the kernel partition your threads according to what part of the memory they will be accessing? Only the application itself knows that e.g. thread A and C will share certain structures in memory, while thread B and D will do so to a lesser degree.
https://docs.microsoft.com/en-us/sql/database-engi... describes how MS solved this with SQL Server 2014. It takes an active role when it comes to thread scheduling. I guess it will set the affinity mask based on which NUMA node it wants to schedule a thread.
Naturally, not all software behaves like a DBMS. A video encoder perhaps won't share so much data between threads (maybe each thread handles a number of frames independently of other threads?) and the NUMA question becomes moot. (unless there are nodes that simply has no direct memory access and needs to go through other nodes -- I got the impression that Threadripper does this)
alpha64 - Friday, October 26, 2018 - link
@BikeDude,You are right that a DBMS is a pretty extreme example of an "application" level software program. In fact, they often use storage devices (SSDs/Hard Drives) bypassing the filesystem too. The fact that Microsoft is doing specific things to handle NUMA in this software is not surprising, but I was not talking about how Microsoft has solved this, but rather how Linux does (better than Windows).
My point was that most software does not set affinity, know, or care the architecture of a NUMA system. The two examples I gave do not, yet they show good performance scaling on TR2990WX. Certainly ugly hacks like CPU affinity can be used to try to fix poor performance due to ineffective scheduling, but the results of this workaround are shown in this article to not help most of the time. Knowing the NUMA tables and actually making intelligent choices based on that are still firmly in the realm of the kernel, not normal applications.
When speaking about memory locality, the operating system does set up the page table structures with the MMU for specific threads/processes. Thus the kernel does have knowledge of which cores are local to the memory for specific threads. Linux scheduling takes into account the NUMA structure and what CPUs are "close" to the memory used for the tasks it is scheduling. Thus, the answer to your first question in your first paragraph is that the kernel does handle this. The situation with sharing certain structures also can be tracked by the kernel.
As your last paragraph states, the TR2990WX does have half of its cores without direct memory access. AMD themselves acknowledged this at release of TR2, and mentioned that this was not a huge performance penalty for most cases. And, if one needs local memory for all NUMA nodes, EPYC does support local memory on all NUMA nodes.
In summary, my point is that in order to get "good" performance from the TR2990WX, Linux achieves this in the kernel without the applications having any special knowledge of the hardware. It seemed that Ian's original paragraph stated otherwise, which is what I was trying to address.
BikeDude - Friday, October 26, 2018 - link
A thread doesn't have its own dedicated MMU.Any thread, at least in a Windows process, can access everything other threads in the process can. Everything is shared. (I've been doing C# for the past 10 years, so I have not kept up to date on the Win32 API and could be wrong)
UNIX apps used to fork() a lot. If that is still the case, then the scheduler will indeed face nicely partitioned unrelated processes. Forking would be a rather unusual thing to do in Windows as spawning new processes comes with a noticeable overhead there.
alpha64 - Friday, October 26, 2018 - link
@BikeDude,Perhaps we are just talking past each other, but in Linux each thread is most often its own process (depending on the libc version used / programming language). The kernel uses copy-on-write to make sure that creating a new thread/process is low-overhead, but still isolated. Regardless, the kernel keeps track of the memory maps for each process (and thread). Thus, the kernel can schedule the applications to run effectively on multiple cores.
Windows does have problems with efficiently forking, while Linux does it well. Regardless, my original point still stands - Linux is able to effectively schedule on NUMA systems without applications having to be programmed with any knowledge of it.
BikeDude - Friday, October 26, 2018 - link
What API functions are involved to allow Linux to keep track of what part of the process' memory space belongs to a given thread? Doesn't most allocations happen through malloc() like they've always done? And how do two threads share memory structures in memory? (You can't assume that merely because thread A allocates a chunk of memory, that thread A will be the only thread accessing it -- one major benefit of using threads is sharing the same address space)Once you have API functions that do those things... You have pushed responsibility over on the application developer to ensure that a given thread gets executed on an optimal NUMA node. Which really is not all that different from playing around with CPU affinity masks (yuck) in the first place.
So, when it comes to threads... I very much doubt it works the way you think it does. Processes -- sure. MMU all the way, etc, but not for threads. That would be downright bizarre.
alpha64 - Friday, October 26, 2018 - link
@BikeDude,I have actually written Linux multithreaded applications in multiple programming languages and worked on the Linux kernel. Linux has mechanisms to set up shared memory segments (mmap), but mostly a shared memory segment like you are describing is allocated before a process calls clone() (to fork() or create a new thread - they make this clone() system call with different parameters). Unless one of the resultant processes lets the operating system know that it will no longer be using the shared segment, both processes have the same memory segment mapped into their process space (kept track of by the kernel). This would be your hypothetical shared memory structure. However, this is simply not done in most programs, as handling shared memory structures by multiple threads of execution is very error-prone. It is far better to use some kind of inter-process communication rather than a shared memory segment where one's own program has to handle locking, contention, and insure consistency.
If you have a Linux system around, try checking into /proc/<pid>/maps to see what memory segments the kernel has mapped for any given process. You can also read up on NTPL (the Threading library that most recent Linux systems use). This is definitely all kept track of by the kernel, and useful for scheduling on NUMA systems.
I think where the confusion in our discussion lies is perhaps in how you think programs are typically designed. I think that shared memory regions are a bad idea due to the complexity of insuring that they will be properly handled. Your assumption seems to be that they are used widely. Perhaps this is due to the different platforms which we use.