Arm Delivers on Cortex A76 Promises: What it Means for 2019 Devices
by Andrei Frumusanu on November 20, 2018 1:10 PM EST- Posted in
- Smartphones
- Snapdragon
- Arm
- Exynos
- SoCs
- Kirin
In the grand scheme of things, it hasn’t been all that long since we first covered Arm’s announcement of the new Cortex A76 CPU microarchitecture. The new CPU IP was publicly unveiled back on the first of June, and Arm had made big promises in regards to the performance and efficiency improvements of the new core. It’s been a little over 5 months since then, and as we originally predicted, we’ve seen vendors announce as well as ship silicon SoCs with the new CPU.
Last week we published our review of the Huawei Mate 20 and Mate 20 Pro – both which contain HiSilicon’s new Kirin 980 chipset. Unfortunately for a lot of our readers which are based in the US, the review won’t be as interesting as the devices won’t be available to them. For this reason I’m writing up a standalone piece focusing more on the results of the new Cortex A76 inside the Kirin 980, and discuss more in detail how I think things will play out in the upcoming generation of competing SoCs.
Verifying Arm’s performance projections
Naturally one of the first things people will be interested in is seeing how the Cortex A76 actually manages to perform in practice. Arm had advertised the Cortex A76 to reach clocks of up to 3GHz, and correspondingly had all of its performance projections presented at this frequency. As I’ve written back in May, the 3GHz frequency was always an overly optimistic target that vendors would not be able to achieve; I said something along 2.5GHz would be a much more realistic figure. The Kirin 980 ended up being released with a final clock speed of 2.6GHz, which was more in line with what I expected.
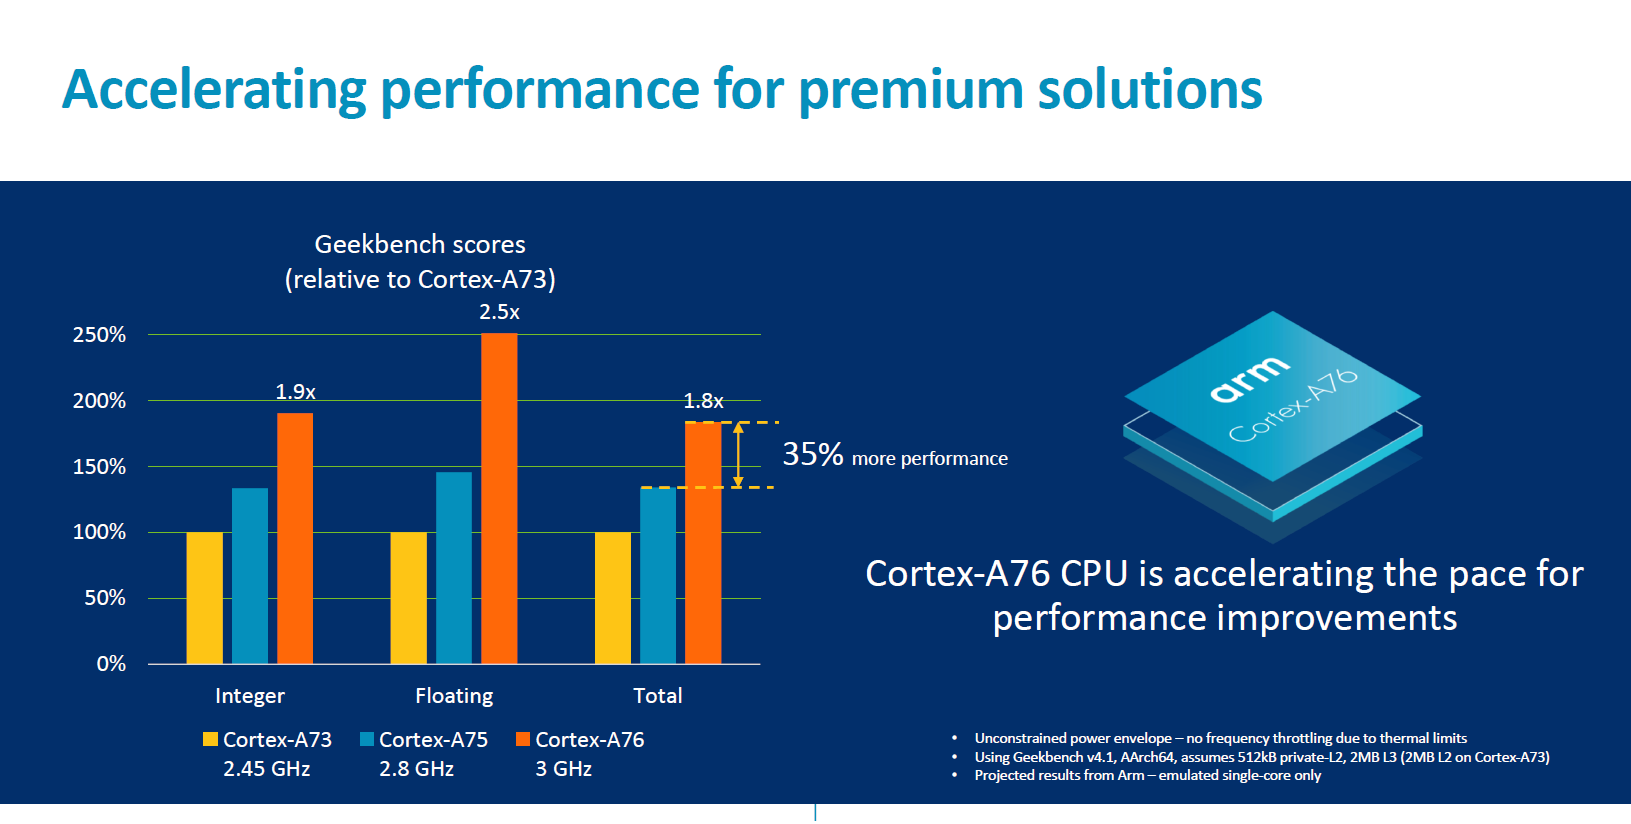
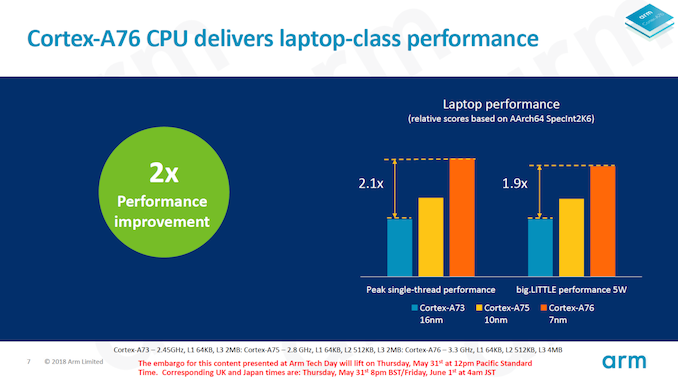
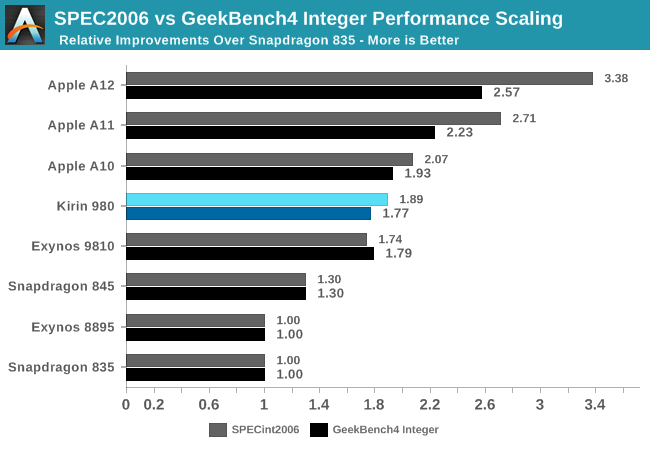
The Cortex A76 at 3GHz was projected to perform respectively 1.9x and 2.5x times better than a Cortex A73 at 2.45GHz – which is the configuration of Qualcomm’s Snapdragon 835. Translated to a clock speed of 2.6GHz, the improvements are adjusted to ~1.65x and ~2.15x.
In practice, the Kirin 980 manages to reach an improvement of 1.77x in the integer score, as well as slightly exceeding the target improvement for the floating point score, achieving an increase of 2.21x. The reason the Kirin 980 here exceeds the targets is maybe linked to the fact that the chip is configured with a 4MB L3 while Arm’s simulations ran with a 2MB L3.
Moving over to SPEC2006, we have a set of more complex and robust workloads that better represent the wider range of applications that you would come to expect.
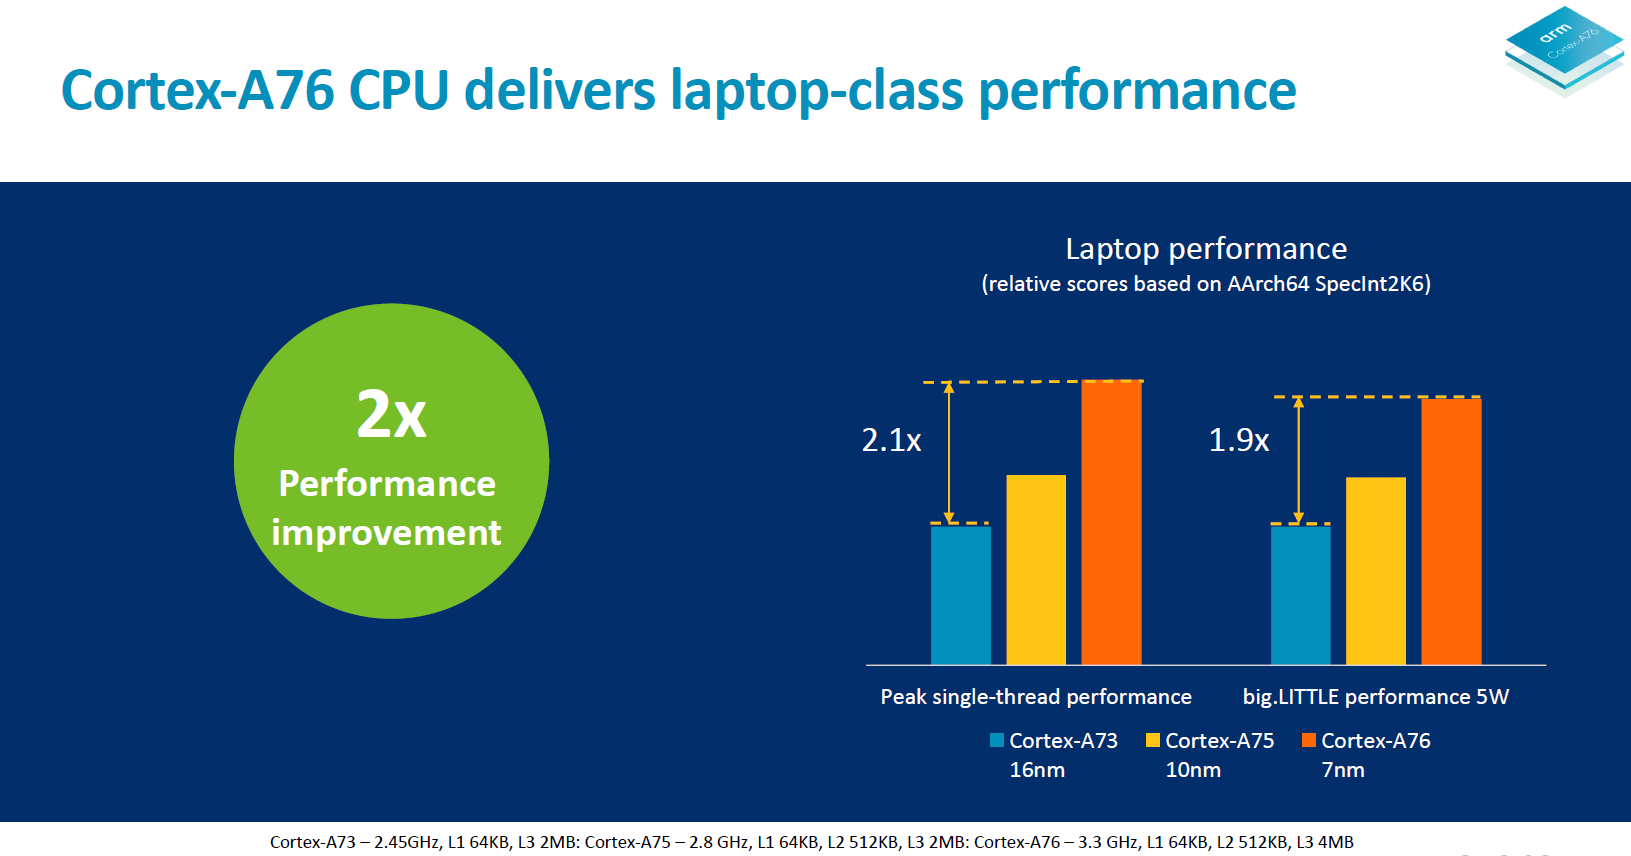
Here Arm’s performance projections were a bit more coloured, as we had been presented IPC comparisons as well as absolute score comparisons. In the absolute improvements at 3GHz, we saw claims of 2.1x “without thermal constraints” at 3.3GHz and figures of 1.9x “within 5W TDPs”. The latter figures was extremely confusing as Arm’s marketing was contradictory as to what this exactly means, which for a long time had me questioning if the CPU would somehow hit thermal limits in the single-threaded SPEC workloads, which would have been a pretty terrible result.
The IPC comparisons are a lot more straightforward: Versus a Cortex A73, we would respectively see increases of 1.58x and 1.79x in the integer and FP suites.
In practice, the Kirin 980 and the Cortex A76 more than delivers: we’re seeing 1.89x and 2.04x increases in the integer and FP scores. In terms of IPC, the increases over the Cortex A73 based Kirin 970 and Snapdragon 835 are even more significant: Here we’re seeing jumps of respectively 1.78x and 1.92x. In fact, because the Kirin 980 performed better than expected, it actually managed to reach my projected scores (based on Arm’s figures) I had estimated for a 3GHz Cortex A76, but actually achieving this at 2.6GHz.
Memory subsystem performance matters enormously
There is one aspect of CPU performance that seems to be continuously misunderstood and misrepresented: Memory subsystem performance. A CPU can be incredibly wide as well as have any amount of execution resources, however no matter how big the microarchitecture is, it matters little if the memory subsystem (caches, memory controllers) are not able to keep the machine properly fed with data. The mobile space over the last few years has pretty much seen the same workload progression that we’ve seen in desktops over the past decades, just in a vastly more accelerated pace. Applications become bigger and more complex in terms of their program sizes, and the data they’re processing has also seen significant growth.
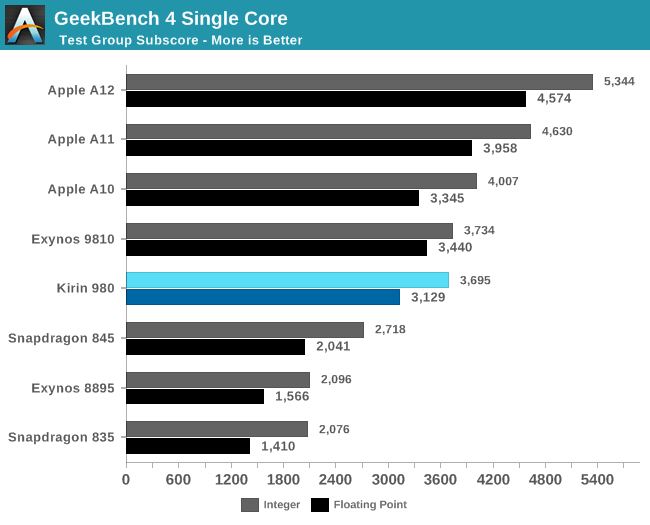
The problem with this evolution is that the tools that we usually use to benchmark performance can become outdated if they can’t accurately reproduce the microarchitectural workload characteristics of modern every-day applications. Recently with the launch of the Kirin 980, I’ve seen some people get the wrong idea and come to the wrong conclusion in terms of the actual performance of the chipset, basing their opinion on results such as GeekBench 4 scores.
To explain this, I wanted to showcase the evolution of recent generation SoCs, all relative to a fixed starting figure. I picked the Snapdragon 835 for this as it represented a well-balanced and popular SoC.
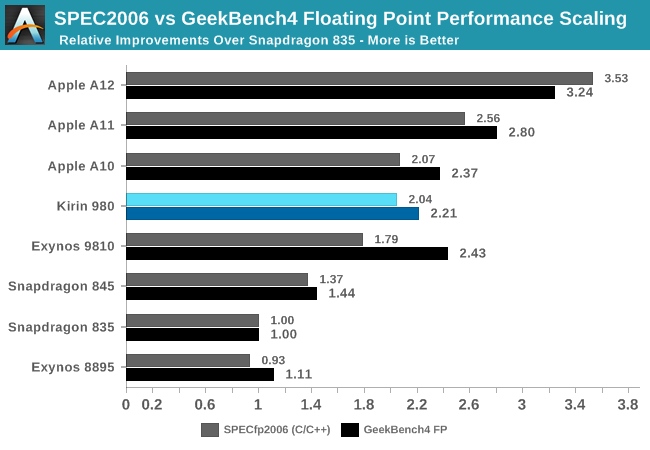
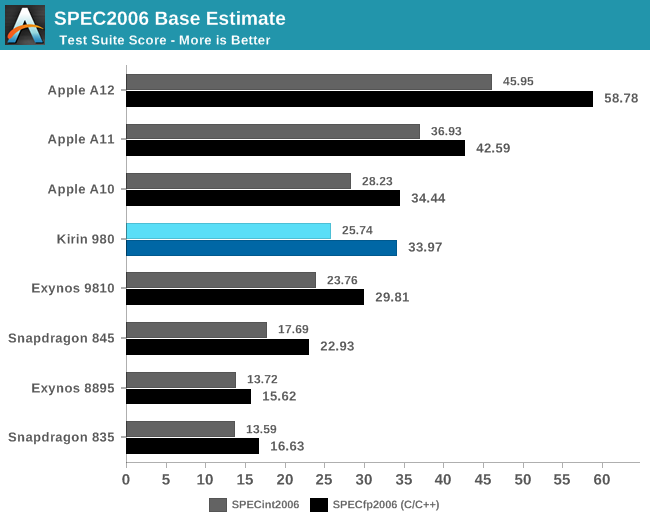
In SPECint2006, the scores don’t seem to diverge all that much from what GeekBench4 is able to project, and this is valid for most SoCs. In this set, the only significant divergence comes from the Apple’s A11 and A12 chips. Here the A11 and A12 were able to show significantly larger increases in the SPEC workload performances than in GB4.
Switching over to SPECfp2006, beyond the obvious fact that the benchmarks here are using more floating point datatypes in their programs, we see a much larger percentage of workloads that are characterised by putting a lot more demand on the memory subsystems. Here, we see a lot more discrepancy between the different SoCs. On one side again, the Apple A12 again was able to showcase much bigger generational improvements in SPECfp than it was able to showcase in GB4’s FP workloads, again pointing out to the massive memory subsystem performance improvements Apple was able to introduce this generation. On the other hand, the Exynos 9810 sticks out in the opposite way: its performance in SPEC was much less than what we see in GeekBench4, again representing the Achilles heel of the chipset as the CPU’s memory and cache subsystem largely lags behind the competition.
The point I’m trying to make here is that the vast majority of real-world applications behave a lot more like SPEC than GeekBench4: Most notably Apple’s new A12 as well as Samsung’s Exynos 9810 contrast themselves in the two extremes as shown above. In more representative benchmarks such as browser JS framework performance tests (Speedometer 2.0), or on the Android side, PCMark 2.0, we see even greater instruction and data pressure than in SPEC – multiplying the differences exposed by SPECfp.
There are also benchmarks who go in the opposite way of their workload characterisation: Dhrystone or Coremark have very small memory footprints. Here most of the benchmark will entirely fit into the lower cache hierarchies of a CPU, not putting any kind of pressure to the bigger caches or even DRAM. These are useful benchmarks still in their own regard, but shouldn’t be taken as a representation of overall performance in modern application. AnTuTu’s CPU test falls among these as its footprint is also tiny and not testing anything beyond the execution engines and the first level cache hierarchy.
HiSilicon’s Kirin 980 along with Arm’s Cortex A76 here seem to strike a great balance in this regard: The performance between SPEC and GeekBench4 doesn’t diverge all too much. We’ll get back this just in a bit when looking at the efficiency results of the new Kirin chipset.
Top-tier energy/power efficiency, absolute performance still quite behind Apple
When it comes to power and energy efficiency, Arm made two claims: At the same power usage, the Cortex A76 would perform 40% better than the Cortex A75, and at the same performance point, the Cortex A76 would use only 50% of the energy of a Cortex A75. Of course these two figures are to be taken with quite a handful of salt as the comparison was made across process nodes.

Looking at the SPEC efficiency results, they seem more than validate Arm’s claims. As I had mentioned before, I had made performance and power projections based on Arm’s figures back in May, and the actual results beat these figures. Because the Cortex A76 beat the IPC projections, it was able to achieve the target performance points at a more efficient frequency point than my 3GHz estimate back then.
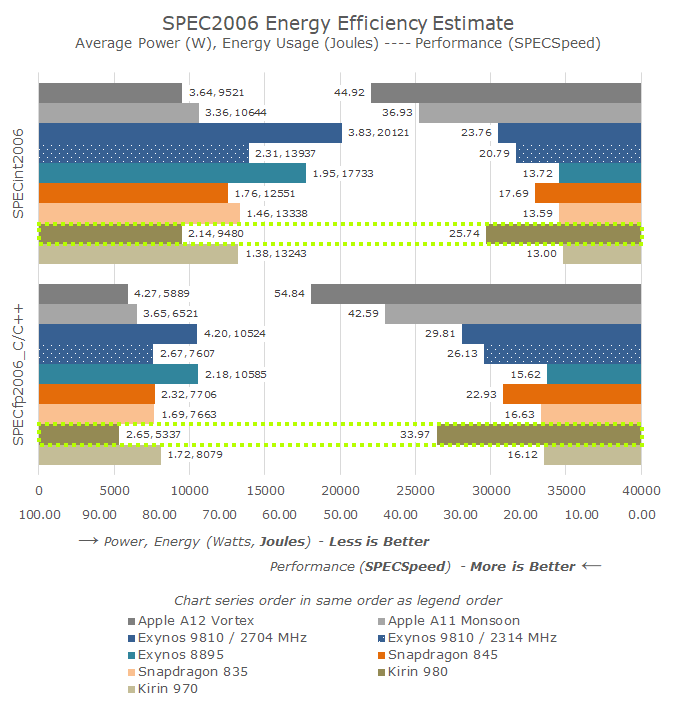
The results for the chip are just excellent: The Kirin 980 beats the Snapdragon 845 in performance by 45-48%, all whilst using 25-30% less energy to complete the workloads. If we were to clock down the Kirin 980 or actually measure the energy efficiency of the lower clocked 1.9GHz A76 pairs in order to match the performance point of the S845, I can very easily see the Kirin 980 using less than half the energy.
The one metric that doesn’t quite pan out for Arm is the claim that at the same power, the Cortex A76 would perform 40% better. Here Arm chose an arbitrary 750mW point for the comparison – which may or may not make the claim accurate, however we don’t know where this intersection point lies, and it would require more exact measurements of the frequency-power curve of both chipsets. The matter of fact is, the Cortex A76 is a more power hungry CPU, and single core active platform power consumption has gone up by 14-21%.
It’s here where we can make the interesting comparison to Apple’s latest: The energy efficiency for the Kirin 980 is ever so slightly ahead of the Apple A12, meaning the perf/W of both SoCs are nearly identical. The big difference here is that Apple is able to achieve a 61-74% performance advantage, at a linear cost of 60-70% increased power consumption.
What it means for next Snapdragon and Exynos 9820
The excellent showing of the Kirin 980 is a good omen for the upcoming Snapdragon flagship. I’m expecting Qualcomm to be a little more aggressive when it comes to the core clocks, aiming just a tad higher above the 2.6GHz of the Kirin 980. What this will actually mean in regards to the resulting power efficiency remains to be seen.
Performance on paper should also fare well, but in practice Qualcomm does have an aspect that can complicate things: the SoC’s system cache. Here evidently Qualcomm is trying to mimic Apple in having a further system-wide cache hierarchy before going to DRAM; for the Snapdragon 845 this was a double-edged sword as memory latency saw a degradation over the Snapdragon 835. This degradation seemingly caused the Cortex A75 in the S845 to maybe not achieve its full potential. Hopefully the new generation SoC has less of an impact in this regard, and we can expect good performance figures.
Samsung last week officially announced the Exynos 9820, and here the outlook is a bit more pessimistic. The Exynos 9810 did not fare well in benchmarks, but this was not only because of the scheduler issues, but also simply because the microarchitecture didn’t seem balanced. The Kirin 980 is able to beat the Exynos 9810’s top performance, all while consuming less than half the energy. At the more reasonable 2.3GHz frequency point of the chip, the performance gap widens to 23-30%, while still showcasing a 42-47% energy efficiency disadvantage over the Kirin 980.
Samsung proclaims that the Exynos 9820 showcases 20% better performance, or 40% better efficiency. The keyword here being “or” – meaning the improvements are at an iso-comparison to the other axis. Taking the 2.7GHz figures as a base comparison, a 20% performance improvement could well compete with the Cortex A76, but the horrid energy efficiency of the chip would still remain. Similarly, taking the more efficient 2.3GHz result as the baseline performance, a 40% improvement in efficiency would match the Kirin 980 in efficiency, but still would have to endure the performance deficit.
Samsung’s marketing figures just aren’t good enough, and mathematically I just don’t see any way the Exynos 9820 would be able to compete if the results do pan out like this. The only glimmer of hope here is that, much like Apple’s marketing department understated the performance improvements of the A12, S.LSI is understating the improvements of the Exynos 9820. Here the only scenario I could see as working out is that the claimed performance jump merely represents GeekBench4 scores, and actual improvements in SPEC and more realistic workloads see a much more significant jump, closing this ratio gap between the two benchmarks that we discussed just earlier. Let’s hope for this latter scenario.
The Cortex A76 is a very solid CPU – Deimos & Hercules will follow up
Arm had already teased the successor to Enyo (Cortex A76) with the reveal of Deimos and Hercules. Here Arm promised 15-20% performance increases in the next generation. Arm’s strength here lies in actually delivering an overall excellent package of performance within great power envelopes. Also while this part of the PPA metric isn’t something consumer should inherently care about, Arm is able to also keep the CPUs extremely small.
We’ve just recently seen Arm’s new server core in the wild – Ares should be the infrastructure counterpart to Enyo/A76 and part of the recently announced Neoverse family of CPU cores. It’s not hard to imagine 32 or 64 of cores of this calibre on a single chip. Overall, we’re looking forward to more exciting products in the next several months – both in the mobile and infrastructure spaces.
Related Reading
- The Mate 20 & Mate 20 Pro Review: Kirin 980 Powering Two Contrasting Devices
- HiSilicon Announces The Kirin 980: First A76, G76 on 7nm
- ChipRebel Releases Kirin 980 Die Shot: Cortex A76's & Mali G76 in View
- Arm's Cortex-A76 CPU Unveiled: Taking Aim at the Top for 7nm
- The Samsung Galaxy S9 and S9+ Review: Exynos and Snapdragon at 960fps
- Samsung Announces 8nm Exynos 9820 With Tri-Group CPU Design
- Hot Chips 2018: Samsung’s Exynos-M3 CPU Architecture Deep Dive
- Huawei Server Efforts: Hi1620 and Arm’s Big Server Core, Ares
- Arm Announces Neoverse Infrastructure IP Branding & Future Roadmap
- Qualcomm Announces Snapdragon 675 - 11nm Mid-Range Cortex A76-Based
- Arm Unveils Client CPU Performance Roadmap Through 2020 - Taking Intel Head On


99 Comments
View All Comments
blu42 - Wednesday, November 21, 2018 - link
Which GB benchmarks are you referring to? Those GB *compute* benchmarks (fp-related) that I've looked at did not use malloc in their timed loops (it would be idiotic if they did).Wilco1 - Wednesday, November 21, 2018 - link
Malloc is significant in Lua, SQLite, HTML5Dom and LLVM. The latter spends ~20% of total time in malloc. Throughput oriented benchmarks won't use malloc in the inner loop of course, but the statement was about all of SPEC. And the fact is both SPEC and GB make system calls. Note the system calls don't add up to a large amount of time - other OS differences such as pagefault handling and page size make a much larger difference.blu42 - Thursday, November 22, 2018 - link
I see. So that means most (all?) of GB throughput tests are perfectly fine for benchmarking then? BTW, the sgemm GB test uses a 16KB dataset -- I sincerely doubt OS page handing plays any measurable role in it.Wilco1 - Thursday, November 22, 2018 - link
Nothing in GB uses a tiny 16KB dataset - workload memory usage is around 32-64MBytes. A single SGEMM matrix is 1MB: https://www.geekbench.com/doc/geekbench4-cpu-workl...OS pagefault handling matters if you use huge amounts of data and initialize it inside the timing loop - that's the case for SPEC, not GB. However GB is affected by the page size.
blu42 - Thursday, November 22, 2018 - link
Perhaps GB used to do sgemm with 512x512 matrices at the writing of that doc -- they don't now.Download Geekbench-4.3.1 for linux, md5 58fa9a984992641cd492c14efae895db, the sgemm relevant addresses are at:
0x52d0f0 : sgemm avx
0x52daf0 : sgemm avx+fma
Observe the calls at 0x52d11c and 0x52db1c in the first and the second routine, respectively -- they both call a malloc wrapper with a tad more (for alignment purposes) than 16KB.
Wilco1 - Thursday, November 22, 2018 - link
You're confused with the traditional blocking optimization which processes the matrices in smaller parts to reduce cachemisses. The source code for an early GB4 shows SGEMM uses 3 matrices of 768x768, so 6.75MB in total. It's possible it was reduced in a later version, or the doc is out of date.blu42 - Thursday, November 22, 2018 - link
Ok, I finally sat down and traced it (as opposed to looking at objdumps) and you're correct -- their current sgemm matrix width is still 768 columns even in the current version. Which means the 16K must be a transit buffer. They also use a registers-only inner kernel in that multiplication, which is why I originally took the 16K was the entire dataset. My bad.Wilco1 - Thursday, November 22, 2018 - link
So it's the document that was out of date then. Thanks for double checking.tuxRoller - Wednesday, November 21, 2018 - link
How are the processes created?rocky12345 - Tuesday, November 20, 2018 - link
Bench marking can be very useful and a great way to see how hardware compares to each other. But it is not exact or even close to that. I say this because you can go from review to review and get very different results with the same hardware being tested because of how the reviewer chose to set things up.Example: CPU testing can have very different results from different websites depending on how the reviewer set everything up. Heck using one board form another can create different results because of how some board makers like to try to cheat the numbers by changing the bus speed slightly or setting certain CPU settings that enhance the performance as in run the CPU out of spec by default with the Auto setting.
So basically a site like Anandtech which can be pretty much trusted to throw out reviews that have solid numbers and the odd time they mess things up they are the first to pull the review or at least correct it which is why I trust their reviews.