Sabrent Rocket XTRM-Q USB / Thunderbolt 3 Dual Mode External SSD Review: Yin and Yang
by Ganesh T S on December 14, 2020 9:30 AM ESTPCMark 10 Storage Bench - Real-World Access Traces
There are a number of storage benchmarks that can subject a device to artificial access traces by varying the mix of reads and writes, the access block sizes, and the queue depth / number of outstanding data requests. We saw results from two popular ones - ATTO, and CrystalDiskMark - in a previous section. More serious benchmarks, however, actually replicate access traces from real-world workloads to determine the suitability of a particular device for a particular workload. Real-world access traces may be used for simulating the behavior of computing activities that are limited by storage performance. Examples include booting an operating system or loading a particular game from the disk.
PCMark 10's storage bench (introduced in v2.1.2153) includes four storage benchmarks that use relevant real-world traces from popular applications and common tasks to fully test the performance of the latest modern drives:
- The Full System Drive Benchmark uses a wide-ranging set of real-world traces from popular applications and common tasks to fully test the performance of the fastest modern drives. It involves a total of 204 GB of write traffic.
- The Quick System Drive Benchmark is a shorter test with a smaller set of less demanding real-world traces. It subjects the device to 23 GB of writes.
- The Data Drive Benchmark is designed to test drives that are used for storing files rather than applications. These typically include NAS drives, USB sticks, memory cards, and other external storage devices. The device is subjected to 15 GB of writes.
- The Drive Performance Consistency Test is a long-running and extremely demanding test with a heavy, continuous load for expert users. In-depth reporting shows how the performance of the drive varies under different conditions. This writes more than 23 TB of data to the drive.
Despite the data drive benchmark appearing most suitable for testing direct-attached storage, we opted to run the full system drive benchmark as part of our evaluation flow. Many of us use portable flash drives as boot drives and storage for Steam games. These types of use-cases are addressed only in the full system drive benchmark.
The Full System Drive Benchmark comprises of 23 different traces. For the purpose of presenting results, we classify them under five different categories:
- Boot: Replay of storage access trace recorded while booting Windows 10
- Creative: Replay of storage access traces recorded during the start up and usage of Adobe applications such as Acrobat, After Effects, Illustrator, Premiere Pro, Lightroom, and Photoshop.
- Office: Replay of storage access traces recorded during the usage of Microsoft Office applications such as Excel and Powerpoint.
- Gaming: Replay of storage access traces recorded during the start up of games such as Battlefield V, Call of Duty Black Ops 4, and Overwatch.
- File Transfers: Replay of storage access traces (Write-Only, Read-Write, and Read-Only) recorded during the transfer of data such as ISOs and photographs.
PCMark 10 also generates an overall score, bandwidth, and average latency number for quick comparison of different drives. The sub-sections in the rest of the page reference the access traces specified in the PCMark 10 Technical Guide.
Booting Windows 10
The read-write bandwidth recorded for each drive in the boo access trace is presented below.
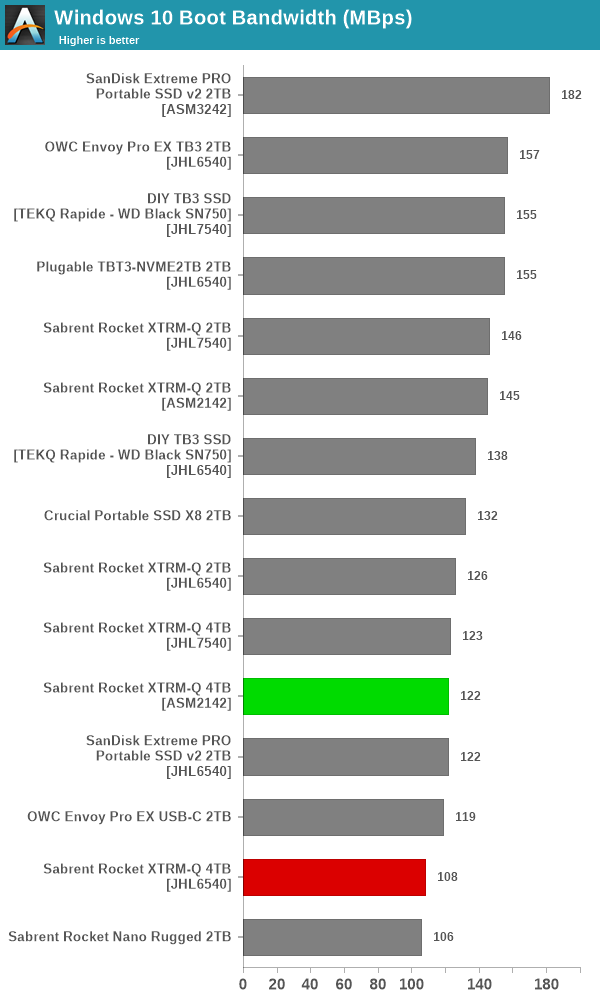
In the Thunderbolt 3 mode, the XTRM-Q models (despite their excellent read speeds evident in the synthetic access traces) makes up the rear end of the pack. However, in USB mode, they perform much better. The 2TB version delivers the best result when compared against all the othe USB 3.2 Gen 2 SSDs.
Creative Workloads
The read-write bandwidth recorded for each drive in the sacr, saft, sill, spre, slig, sps, aft, exc, ill, ind, psh, and psl access traces are presented below.
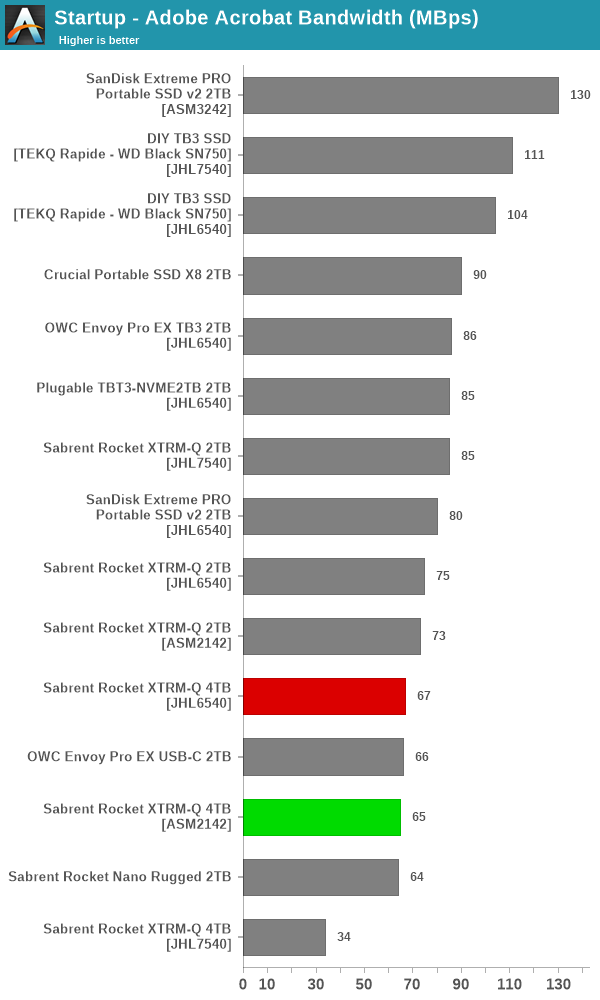
The performance of the XTRM-Q drives for creative workloads in the Thunderbolt 3 mode is nothing to write home about. However, in USB mode the drives perform well, with the 2TB version again performing a bit better than the 4TB one in most workloads.
Office Workloads
The read-write bandwidth recorded for each drive in the exc and pow access traces are presented below.
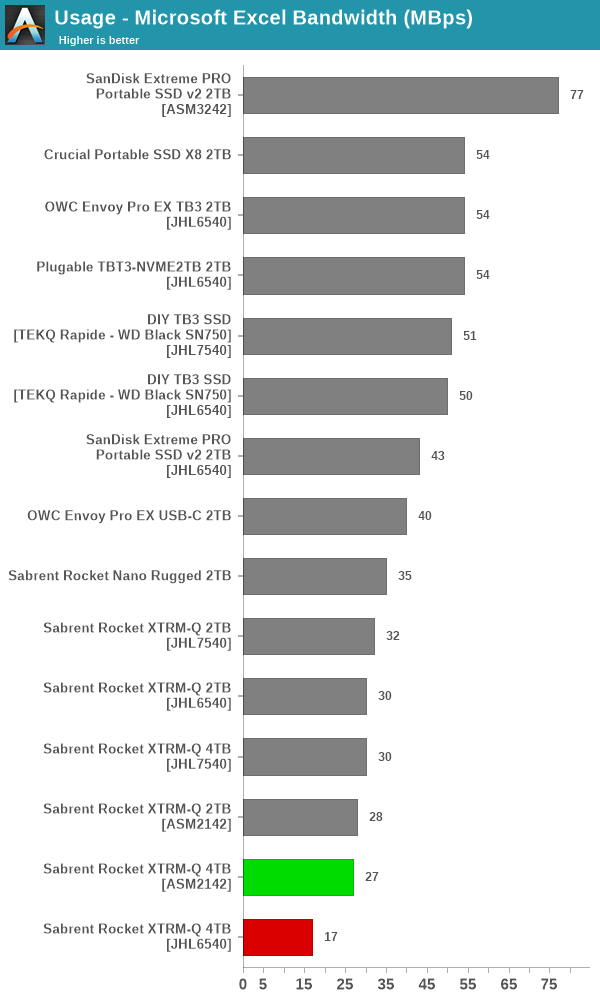
The disappointment in the Thunderbolt 3 performance is compensated by the passable numbers in the USB mode for office workloads.
Gaming Workloads
The read-write bandwidth recorded for each drive in the bf, cod, and ow access traces are presented below.
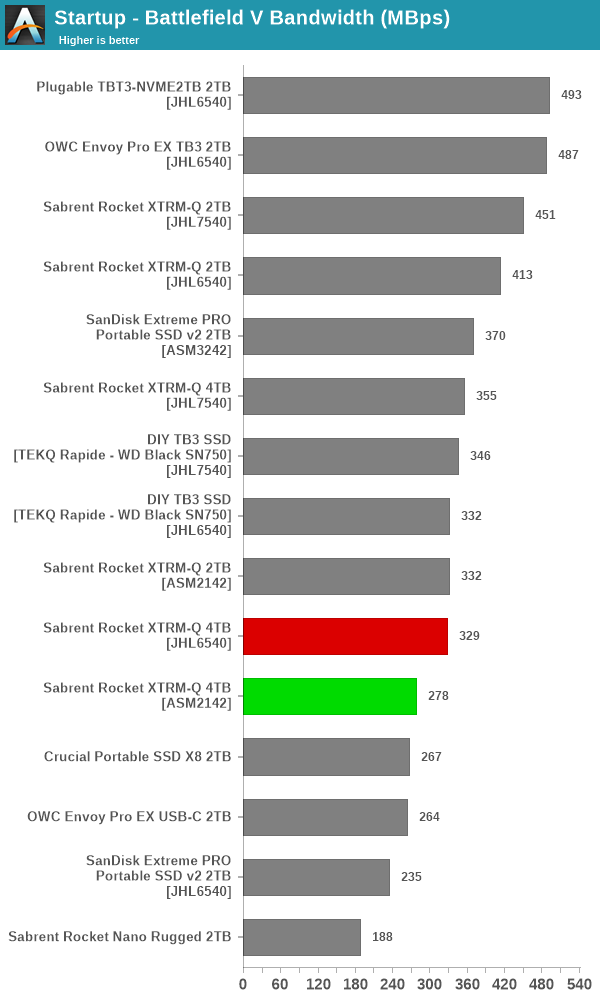
Most gaming workloads are read-intensive, and this works well for the XTRM-Q models. Across all three test configurations (JHL7540 host, JHL6540 host, and USB mode), the 2TB version performs admirably, while the 4TB version performs well enough to be in the middle of the pack.
Files Transfer Workloads
The read-write bandwidth recorded for each drive in the cp1, cp2, cp3, cps1, cps2, and cps3 access traces are presented below.
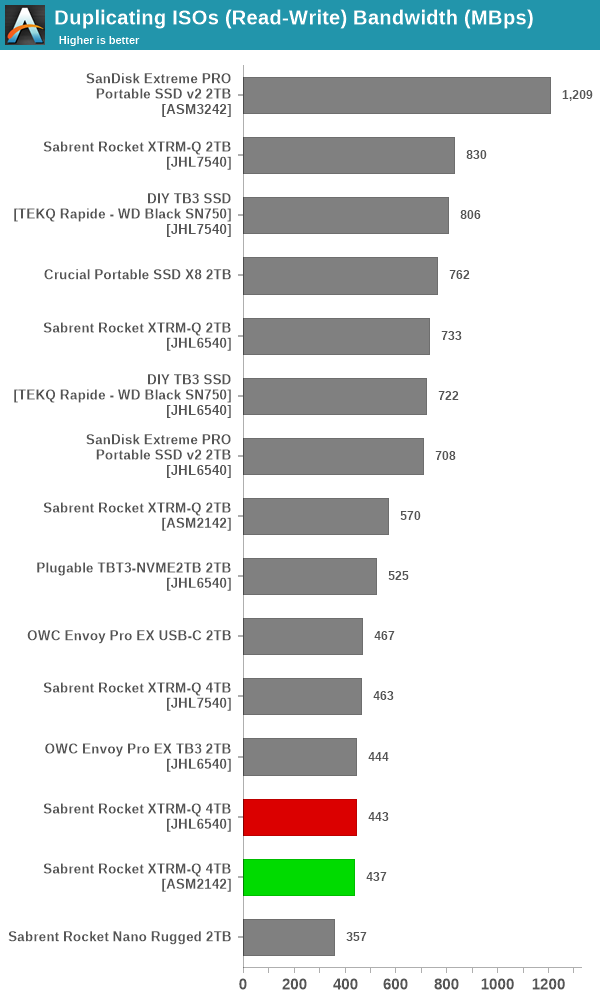
The numbers here are similar to our DAS suite (robocopy) workload. It is the same story, with the USB mode performing well, while the Thunderbolt 3 mode is onlly passable.
Overall Scores
PCMark 10 reports an overall score based on the observed bandwidth and access times for the full workload set. The score, bandwidth, and average access latency for each of the drives are presented below.
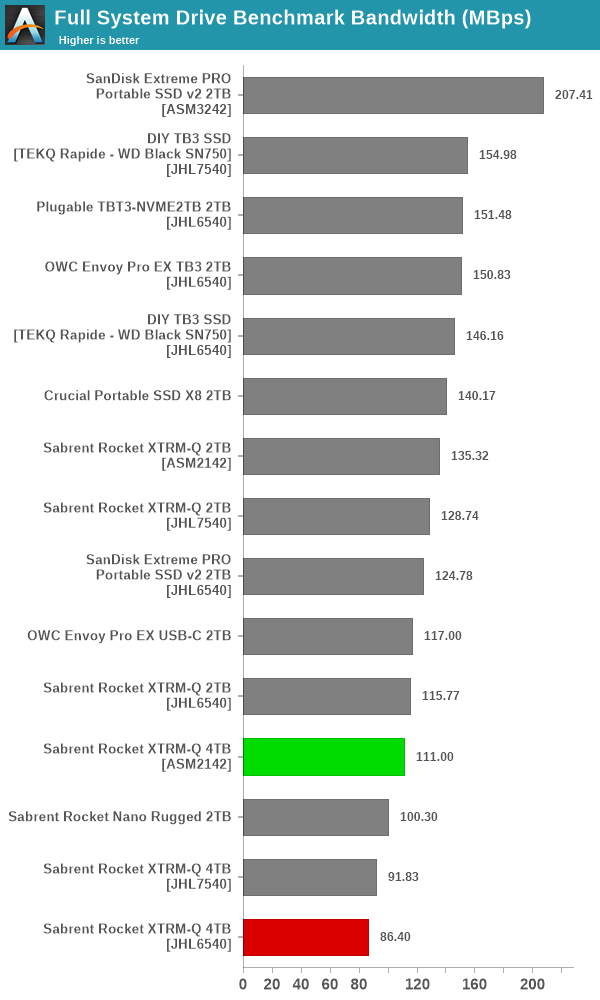
The overall scores reflect our inferences from the previous set of tests - the 2TB performs better than the 4TB version for the most part, and the USB mode delivers competitive performance (again, for the 2TB version in particular). When compared against other Thunderbolt 3 SSDs, the performance numbers are strictly average.


14 Comments
View All Comments
s.yu - Monday, December 14, 2020 - link
The greatest thing I learned from this article is that TB drives usually aren't backward compatible with USB, it never even came to me that that would be possible. Good thing I didn't buy a TB housing for my SSD which would've been quite a bit more expensive than the USB version.ballsystemlord - Monday, December 14, 2020 - link
@Ganesh Could you just create the tables without JS? They might list a lot of images, but at least it would all be there.KimGitz - Tuesday, December 15, 2020 - link
I have been hoping to see this dual operation on audio interfaces. With Thunderbolt 4 and USB 4 offering the same bandwidth the fall back from Thunderbolt to USB would offer similar performance and features using the Jhl8440 Goshen Ridge Controller. I think all docks and peripherals in future should just support Thunderbolt 4 and USB4 dual use.Deicidium369 - Wednesday, December 16, 2020 - link
That's the point of TB4 - which is just a certification by Intel that both the TB3 and USB4 are implementing the whole spec for both. TB4 is TB3 - 40Gb/s... So by definition a TB4 is an Intel certified TB3 + USB4 system.