The Intel SSD 670p (2TB) Review: Improving QLC, But Crazy Pricing?!?
by Billy Tallis on March 1, 2021 12:00 PM ESTBurst IO Performance
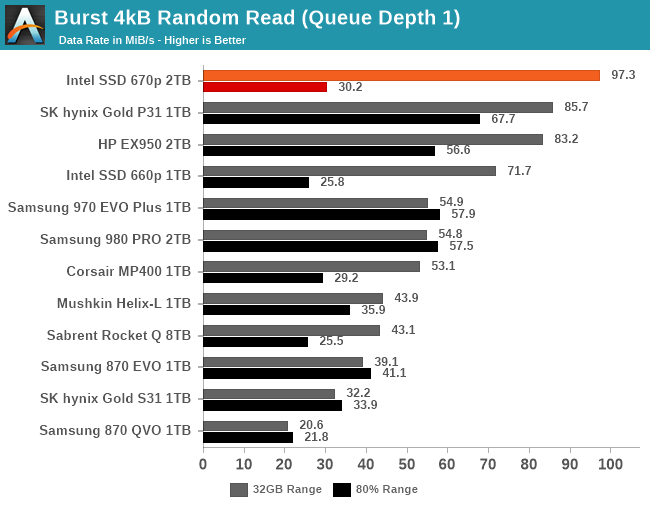
Our burst IO tests operate at queue depth 1 and perform several short data transfers interspersed with idle time. The random read and write tests consist of 32 bursts of up to 64MB each. The sequential read and write tests use eight bursts of up to 128MB each. For more details, please see the overview of our 2021 Consumer SSD Benchmark Suite.
 |
|||||||||
| Random Read | Random Write | ||||||||
| Sequential Read | Sequential Write | ||||||||
For quite a while, NVMe SSDs with Silicon Motion controllers have been delivering some of the best QD1 burst random read performance scores. The Intel SSD 670p pushes this even further, when the test is only hitting the SLC cache. When testing against an 80% full drive, the burst random read performance is faster than most other QLC drives but slower than any good TLC drive.
For QD1 random writes, the 670p is actually slightly slower than the 660p when testing a mostly-full drive, though it is again competitive with more high-end TLC drives when writing to the SLC cache. For both sequential reads and sequential writes, the 670p offers very good QD1 throughput for a PCIe 3.0 drive, and is much improved over the 660p that is seriously bottlenecked by its low-end controller.
Sustained IO Performance
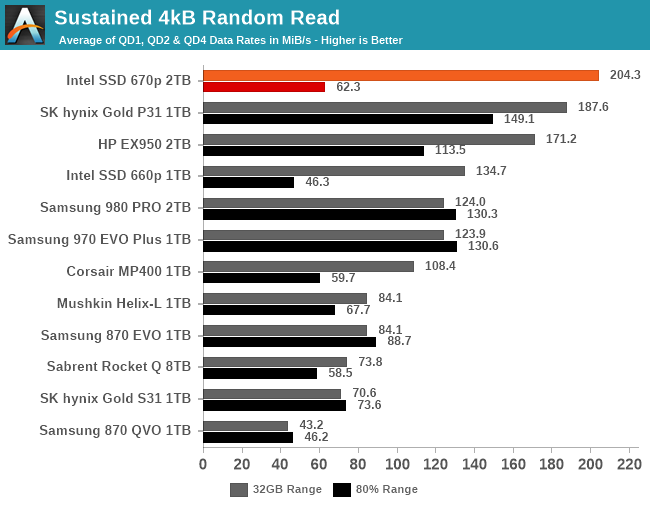
Our sustained IO tests exercise a range of queue depths and transfer more data than the burst IO tests, but still have limits to keep the duration somewhat realistic. The primary scores we report are focused on the low queue depths that make up the bulk of consumer storage workloads. For more details, please see the overview of our 2021 Consumer SSD Benchmark Suite.
 |
|||||||||
| Random Read | Throughput | Power | Efficiency | ||||||
| Random Write | Throughput | Power | Efficiency | ||||||
| Sequential Read | Throughput | Power | Efficiency | ||||||
| Sequential Write | Throughput | Power | Efficiency | ||||||
As with the burst IO scores, the longer sustained IO tests show the Intel 670p doing very well with sequential reads or writes: the performance doesn't betray the fact that it's using QLC NAND, and the power efficiency is typical of a last-generation controller. For random reads or writes, the performance at low queue depths is similarly great when testing the SLC cache, but testing across an 80% full drive knocks performance down to typical entry-level NVMe and mainstream SATA territory. Random writes in particular are disappointing on the mostly-full drive: it's slower than the 660p and the Phison E12-based Corsair MP400, though still several times faster than the DRAMless Mushkin Helix-L.
 |
|||||||||
| Random Read | |||||||||
| Random Write | |||||||||
| Sequential Read | |||||||||
| Sequential Write | |||||||||
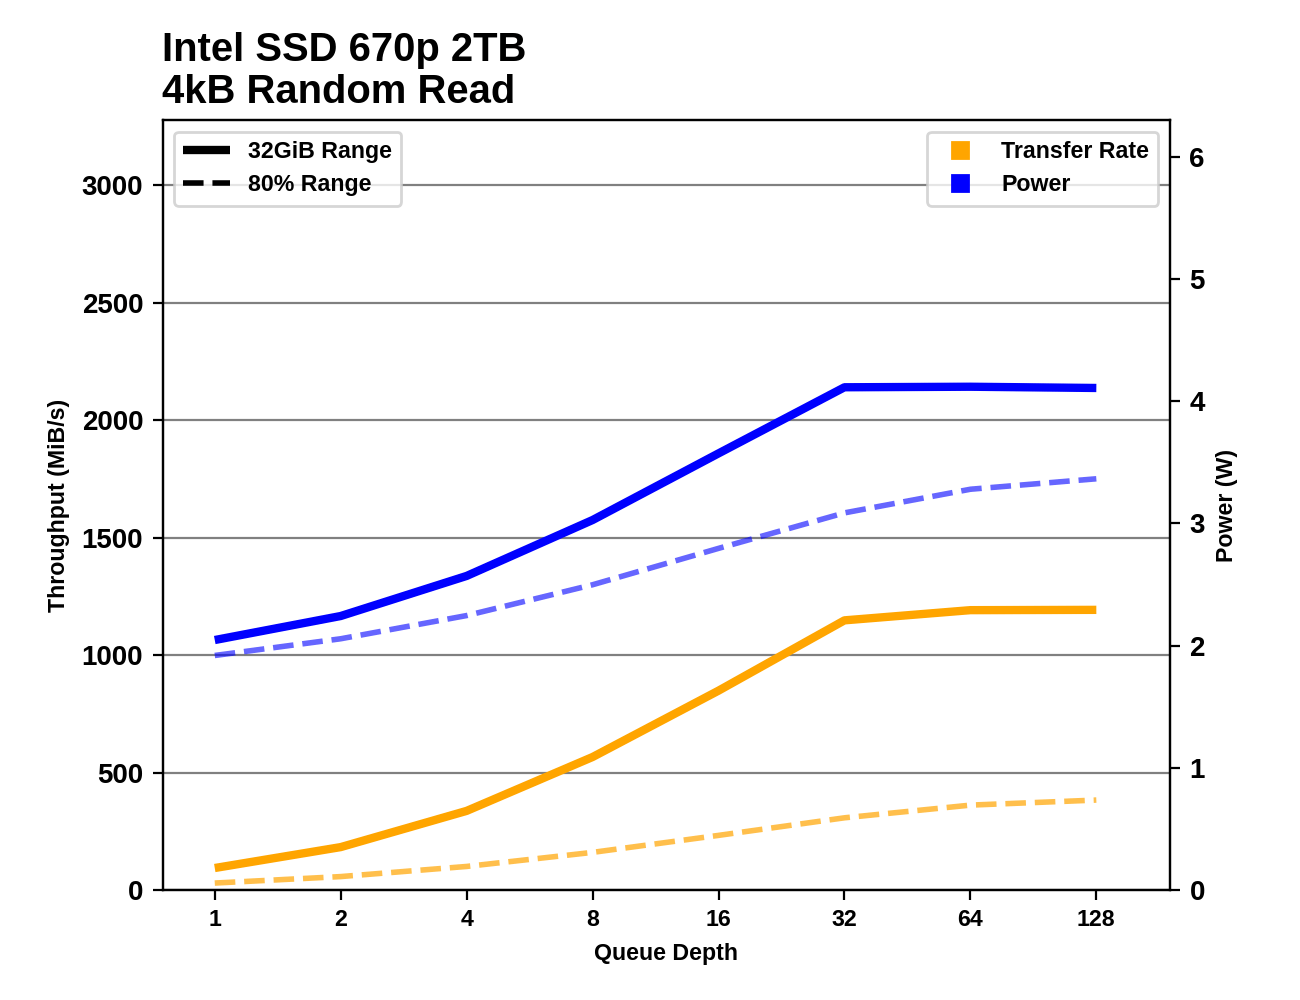
The Intel 670p is fairly well-behaved through the sustained IO tests as the queue depth ramps up. Random reads saturate around QD32, random writes around QD8, and sequential transfers at QD2. Performance is very consistent after the drive reaches its full speed; the only big drop comes at the very end of the sequential write test on a mostly-full drive, when the SLC cache finally runs out while testing at QD128. This is pretty much never going to happen during ordinary consumer workloads.
Random Read Latency
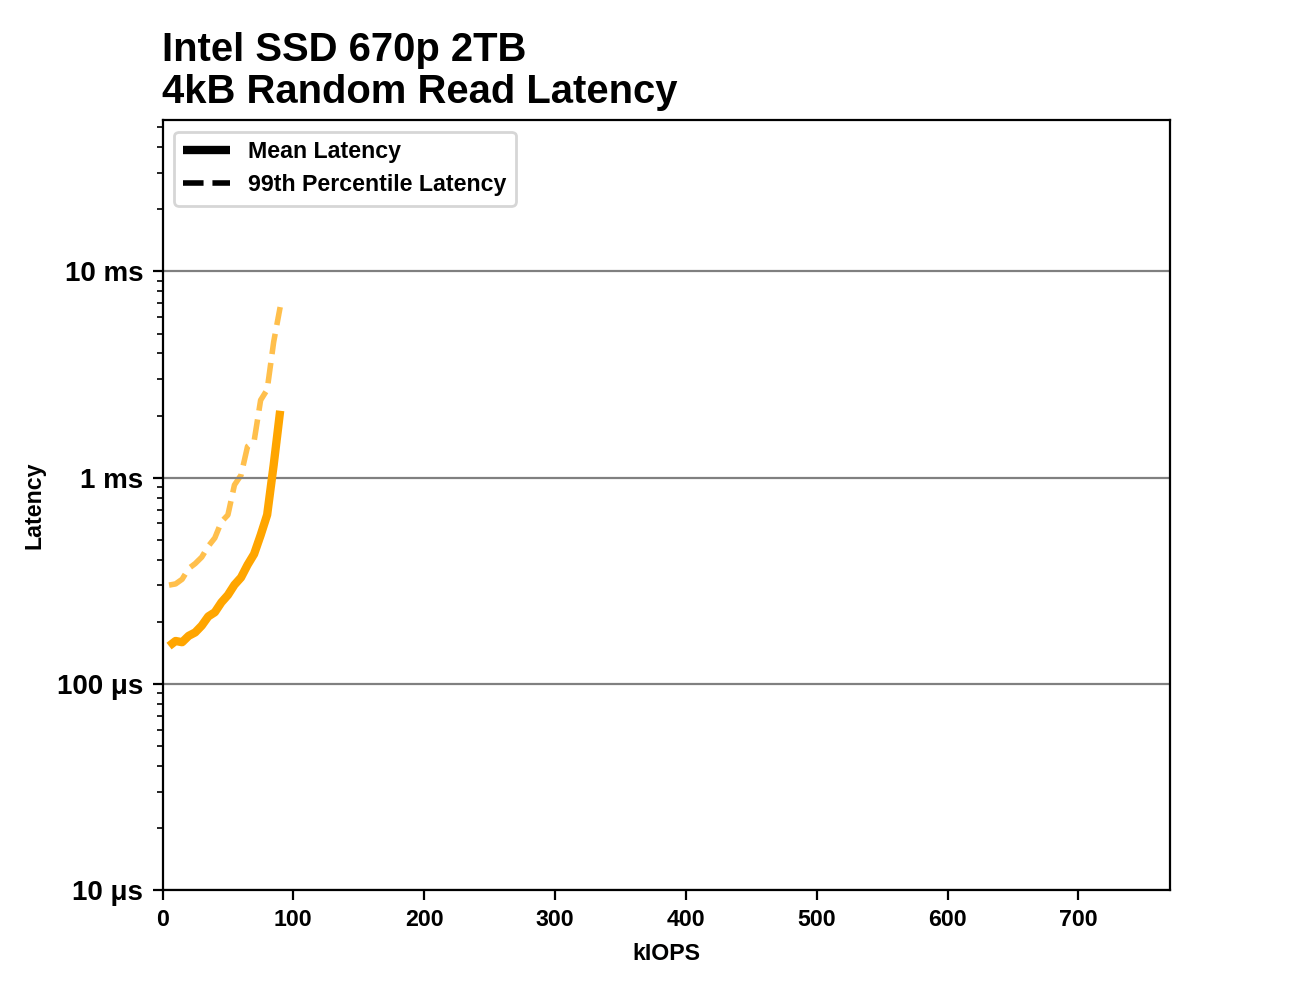
This test illustrates how drives with higher throughput don't always offer better IO latency and Quality of Service (QoS), and that latency often gets much worse when a drive is pushed to its limits. This test is more intense than real-world consumer workloads and the results can be a bit noisy, but large differences that show up clearly on a log scale plot are meaningful. For more details, please see the overview of our 2021 Consumer SSD Benchmark Suite.
 |
|||||||||
Taking a closer look at random read throughput and latency, the Intel 670p fares better than most of the other QLC drives, save for the 8TB Sabrent Rocket Q. The 670p has slightly worse performance than the DRAMless TLC Mushkin Helix-L. The throughput achieved by the 670p is similar to mainstream TLC SATA drives, but the latency is considerably higher: the SATA drives are bottlenecked by the SATA link itself, while the 670p's bottleneck is on the NAND side, which causes latency to spike as the drive is pushed to its limit.


72 Comments
View All Comments
octacore - Friday, March 5, 2021 - link
"It’s very important, for instance, that the latest Nvidia card is selling out at $600 despite having a vastly lower MSRP"Huh? Isn't it exactly illustrate my point? Do not take MSRP seriously, it is retail price that's matter. Same as not focus what someone says, it is what he does (I am not here to defend Intel at all)
bananaforscale - Wednesday, March 3, 2021 - link
Overpriced and irrelevant.