The Inland Performance Plus 2TB SSD Review: Phison's E18 NVMe Controller Tested
by Billy Tallis on May 13, 2021 8:00 AM ESTAnandTech Storage Bench - The Destroyer
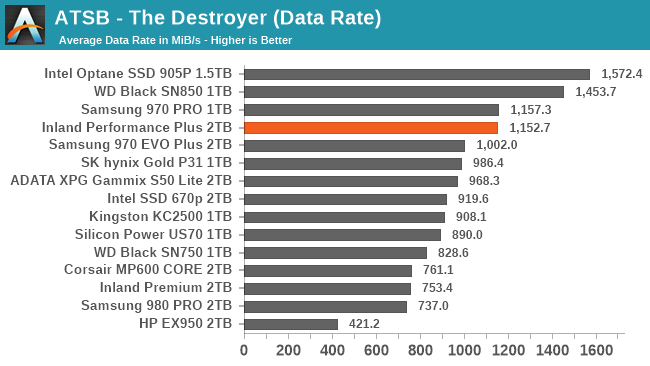
Our AnandTech Storage Bench tests are traces (recordings) of real-world IO patterns that are replayed onto the drives under test. The Destroyer is the longest and most difficult phase of our consumer SSD test suite. For more details, please see the overview of our 2021 Consumer SSD Benchmark Suite.
 |
|||||||||
| Average Data Rate | |||||||||
| Average Latency | Average Read Latency | Average Write Latency | |||||||
| 99th Percentile Latency | 99th Percentile Read Latency | 99th Percentile Write Latency | |||||||
| Energy Usage | |||||||||
The Inland Performance Plus delivers excellent overall performance on The Destroyer, but the WD Black SN850 beats it on almost every subscore. The best result from the E18 drive is with write latency, where it is the clear leader in average latency and a close second in 99th percentile latency. The energy efficiency of the Inland Performance Plus is poor—common for high-end drives, but Samsung and especially WD are better here.
AnandTech Storage Bench - Heavy
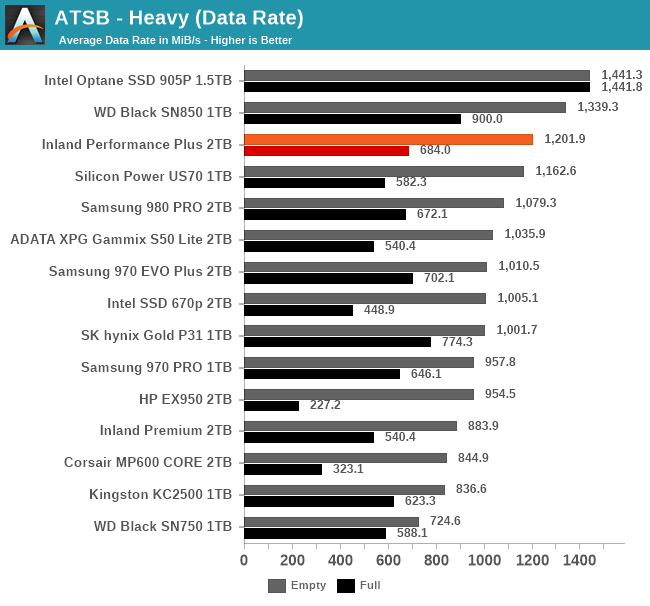
The ATSB Heavy test is much shorter overall than The Destroyer, but is still fairly write-intensive. We run this test twice: first on a mostly-empty drive, and again on a completely full drive to show the worst-case performance.
 |
|||||||||
| Average Data Rate | |||||||||
| Average Latency | Average Read Latency | Average Write Latency | |||||||
| 99th Percentile Latency | 99th Percentile Read Latency | 99th Percentile Write Latency | |||||||
| Energy Usage | |||||||||
On the Heavy test, the Inland Performance Plus delivers great performance, though again it falls short of the WD Black SN850. It's also only a small improvement over the Phison E16-based Silicon Power US70, and several of the best Gen3 drives end up with better performance when testing against a full drive. The Performance Plus is also one of the most power-hungry drives on this test, again requiring almost 50% more energy to finish the tests than the WD Black SN850.
AnandTech Storage Bench - Light
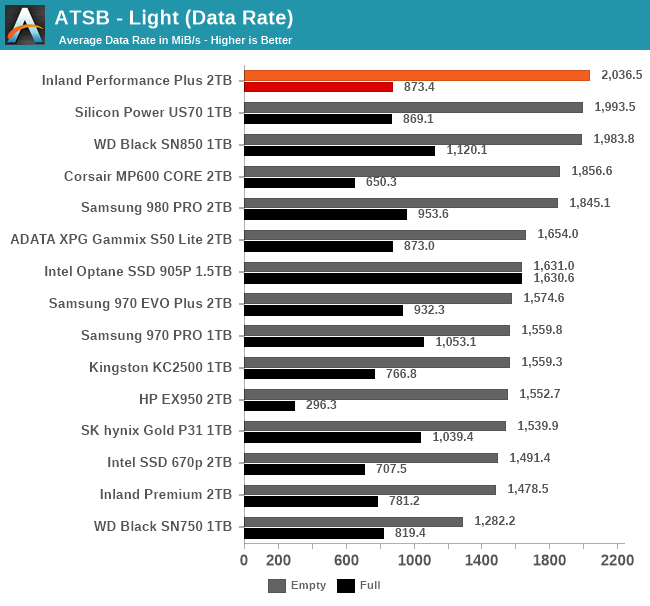
The ATSB Light test represents ordinary everyday usage that doesn't put much strain on a SSD. Low queue depths, short bursts of IO and a short overall test duration mean this should be easy for any SSD. But running it a second time on a full drive shows how even storage-light workloads can be affected by SSD performance degradation.
 |
|||||||||
| Average Data Rate | |||||||||
| Average Latency | Average Read Latency | Average Write Latency | |||||||
| 99th Percentile Latency | 99th Percentile Read Latency | 99th Percentile Write Latency | |||||||
| Energy Usage | |||||||||
The Inland Performance Plus manages a first-place finish for overall performance on the Light test, but it's only a hair faster than the Phison E16 drive or the WD Black SN850—and the WD Black has significantly better performance on the full-drive test run. The Performance Plus also doesn't quite manage first place on most of the latency subscores, and it shows a larger full-drive penalty to the write latency scores than most other high-end drives. The Inland Performance Plus is also in last place for energy usage.
PCMark 10 Storage Benchmarks
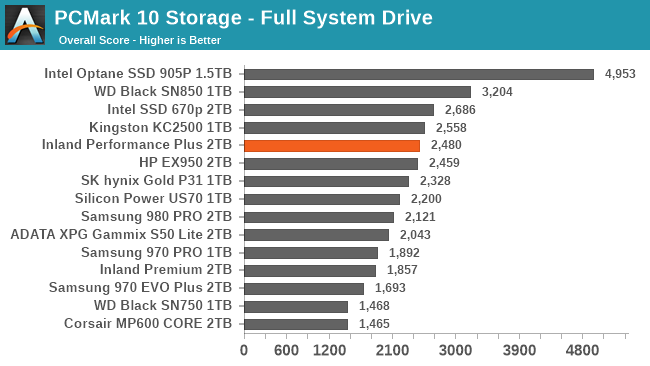
The PCMark 10 Storage benchmarks are IO trace based tests similar to our own ATSB tests. For more details, please see the overview of our 2021 Consumer SSD Benchmark Suite.
 |
|||||||||
| Full System Drive | Overall Score | Average Bandwidth | Average Latency | ||||||
| Quick System Drive | Overall Score | Average Bandwidth | Average Latency | ||||||
| Data Drive | Overall Score | Average Bandwidth | Average Latency | ||||||
The Inland Performance Plus provides decent but not chart-topping performance on the PCMark 10 Storage tests. For the Full System Drive and Quick System Drive tests it is not able to outperform some of the faster Silicon Motion-based NVMe drives that usually provide lower random read latency than Phison drives. On the Data Drive test that is more focused on sequential IO, several older Phison drives provide better performance, suggesting that the firmware for the E18 is tuned more for general real-world performance rather than exclusively trying to maximize simple benchmark scores—but we'd still like to see a controller this powerful consistently beating its predecessors on all kinds of workloads.


118 Comments
View All Comments
RSAUser - Friday, May 14, 2021 - link
Even then, storage is substantially cheaper than RAM, but it will be interesting to see if e.g. 64-128GB RAM configs will become a more common thing (since 64GB/memory die on DDR5 vs 16GB/die on DDR4).oRAirwolf - Thursday, May 13, 2021 - link
Great article as always. I do wish Anandtech would add some real world performance numbers like Windows load times, game load times, file transfer speeds, etc.jospoortvliet - Friday, May 14, 2021 - link
That is exactly what the trace tests on page 2 are.Spunjji - Friday, May 14, 2021 - link
Those kind of tests aren't going to show any noticeable differences. I'm saying this as someone who has personally messed around with configurations like having 6 SATA 3 SSDs in RAID-0, various flavours of NVMe, etc.mode_13h - Saturday, May 15, 2021 - link
> having 6 SATA 3 SSDs in RAID-0Depends on your controller and how it's connected. I have a fileserver with 3x SATA SSDs in a RAID-5, and my bottleneck is the DMI link.
Spunjji - Monday, May 17, 2021 - link
Sort-of, and sort-of not - you'll get lower performance on devices connected over a chipset link than directly, but in terms of Windows and game load times you're rarely going to see more than single-second differences.For the record, my 6-drive array was connected directly to the CPU via a PCIe 3.0 8x RAID card. It would be handily outperformed by a modern ~1TB NVMe drive, and the RAID BIOS initialization time easily eclipsed the minor difference it made to Windows load times over a single drive. I didn't keep it around for long - it was just a thing I tried because I ended up with a bunch of 256GB SATA SSDs and some spare time.
edzieba - Monday, May 17, 2021 - link
I'd love to see the recent crop of "New Faster PCIe 4.0!" drives be tested on both PCIe 4.0 and PCIe 3.0 (on the same system, just with the bus capped) to control for meaningful improvements i ndrive controller performance vs. meaning improvements from link rate increase.I suspect that the majority of performance gain from new drives is down to using newer controllers, and those without PCIe 4.0 capable boards would see near identical performance.
KarlKastor - Tuesday, May 18, 2021 - link
@Billy TallisCan you please write the NAND manufacturer in the lists? You just write the No of Layers. The difference between Toshiba and Micron NAND were sometimes quite huge in the past.