The Inland Performance Plus 2TB SSD Review: Phison's E18 NVMe Controller Tested
by Billy Tallis on May 13, 2021 8:00 AM ESTBurst IO Performance
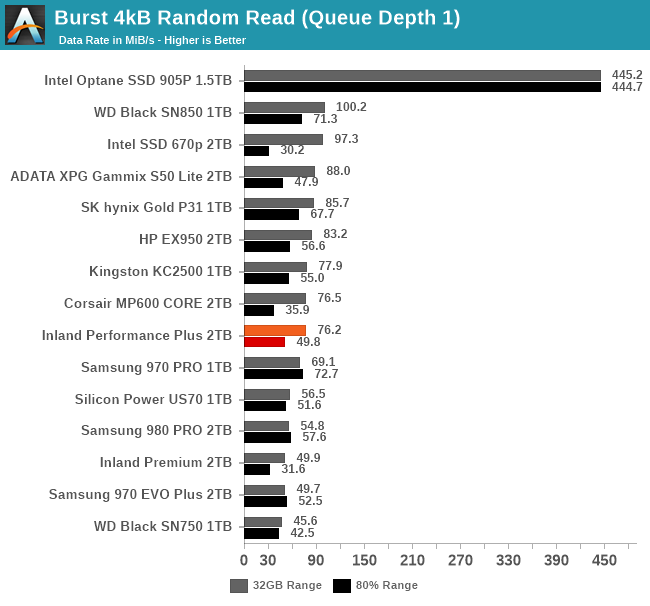
Our burst IO tests operate at queue depth 1 and perform several short data transfers interspersed with idle time. The random read and write tests consist of 32 bursts of up to 64MB each. The sequential read and write tests use eight bursts of up to 128MB each. For more details, please see the overview of our 2021 Consumer SSD Benchmark Suite.
 |
|||||||||
| Random Read | Random Write | ||||||||
| Sequential Read | Sequential Write | ||||||||
On the QD1 burst IO tests, the Inland Performance Plus tops the charts for both random and sequential writes, though in the latter case performance drops quite a lot when the drive is mostly full. Random read performance is merely average, and sequential reads are disappointingly in last place.
Sustained IO Performance
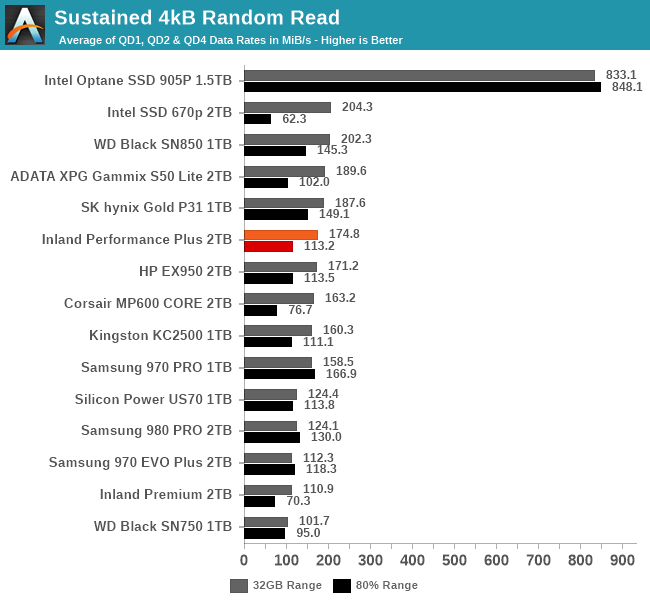
Our sustained IO tests exercise a range of queue depths and transfer more data than the burst IO tests, but still have limits to keep the duration somewhat realistic. The primary scores we report are focused on the low queue depths that make up the bulk of consumer storage workloads. For more details, please see the overview of our 2021 Consumer SSD Benchmark Suite.
 |
|||||||||
| Random Read | Throughput | Power | Efficiency | ||||||
| Random Write | Throughput | Power | Efficiency | ||||||
| Sequential Read | Throughput | Power | Efficiency | ||||||
| Sequential Write | Throughput | Power | Efficiency | ||||||
On the longer IO tests that bring in some higher queue depths, the Performance Plus loses its first-place spot for random writes to the WD Black SN850, but it hangs on to first place for sequential writes. For both random and sequential reads it manages to improve its standings slightly, but the sequential read performance remains disappointing. Power efficiency isn't great on any of these four tests, but it's decent for sequential writes and more or less matches the flagship Gen4 drives from WD and Samsung.
 |
|||||||||
| Random Read | |||||||||
| Random Write | |||||||||
| Sequential Read | |||||||||
| Sequential Write | |||||||||
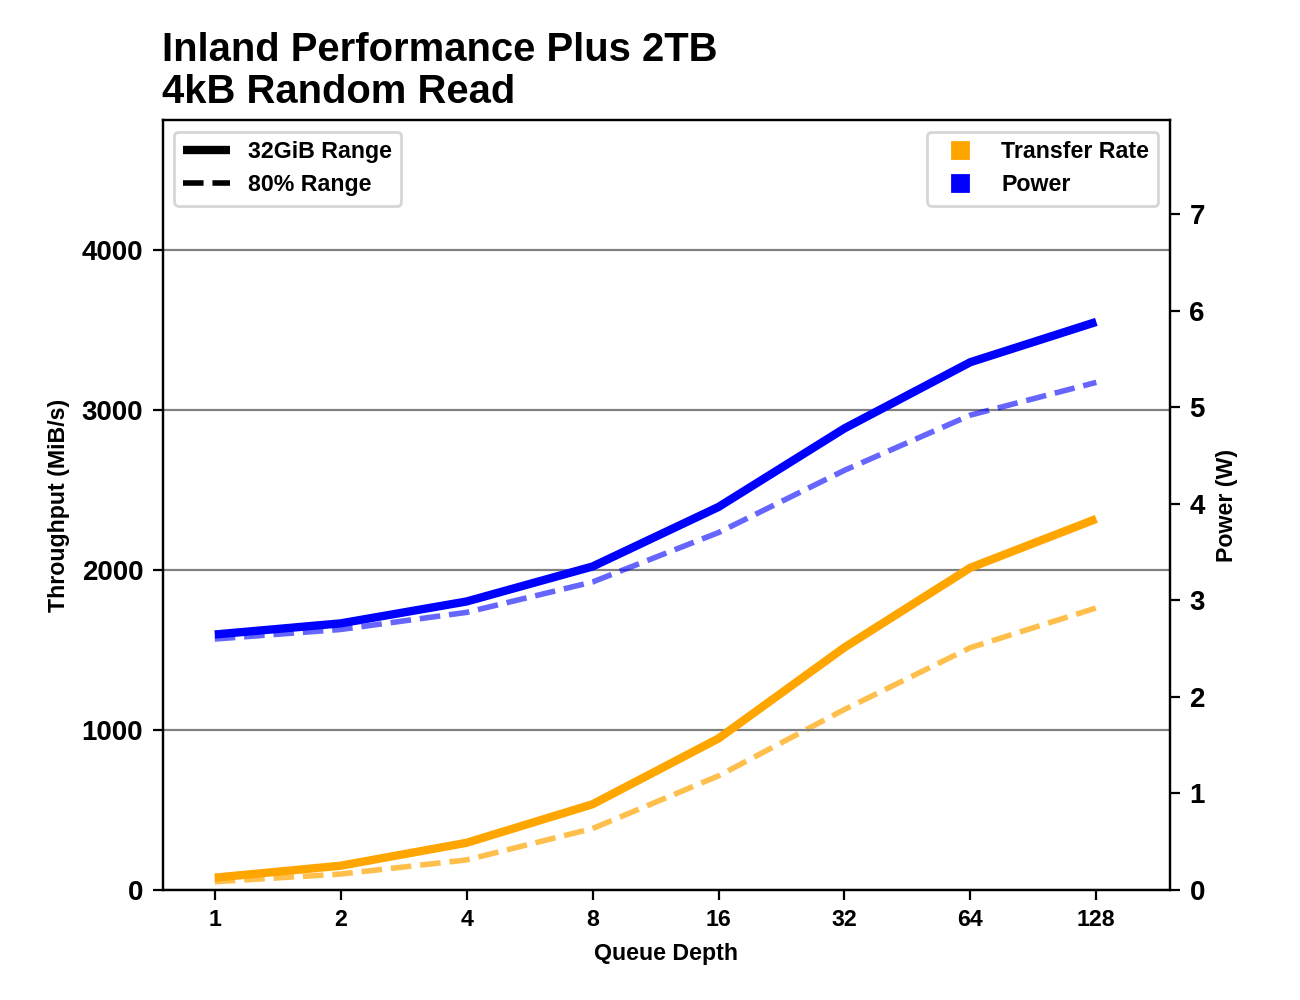
The Inland Performance Plus does eventually reach top-tier performance for sequential reads, but it requires higher queue depths than the 980 PRO or SN850. For sequential writes, it has taken a clear lead by QD4 and maintains higher performance than any of the other drives can hit, with only a slight drop at the end of the test suggesting that the SLC cache might be starting to run out.
For random reads and writes, the Performance Plus simply doesn't scale up as high as its competitors, even with very large queue depths. The Samsung 980 PRO's maximum random write speeds are well beyond what any other drive hits, and for random reads the WD Black SN850 has a similarly large lead over the competition.
Random Read Latency
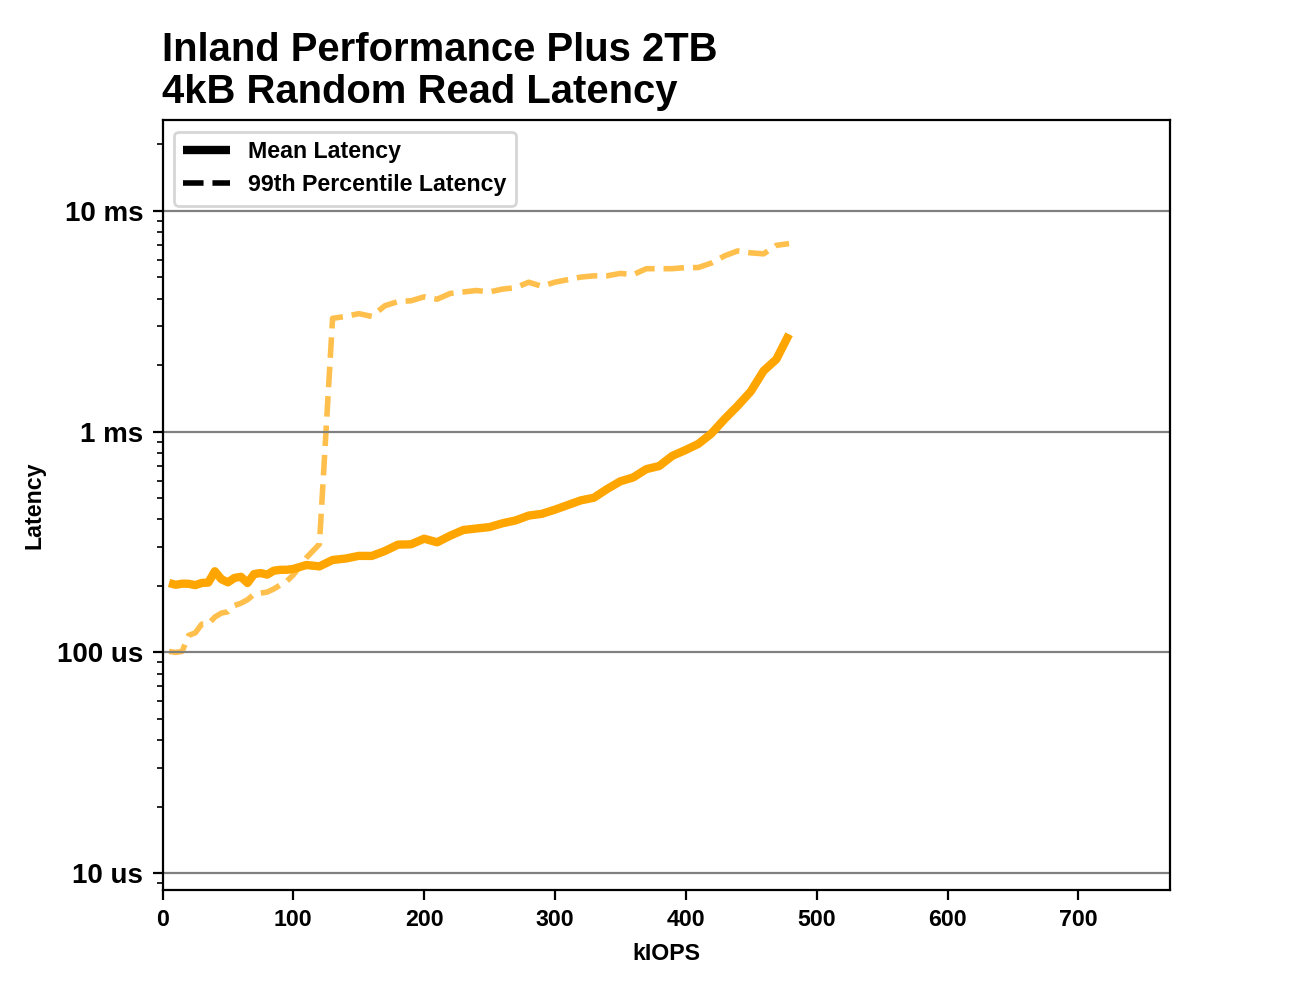
This test illustrates how drives with higher throughput don't always offer better IO latency and Quality of Service (QoS), and that latency often gets much worse when a drive is pushed to its limits. This test is more intense than real-world consumer workloads and the results can be a bit noisy, but large differences that show up clearly on a log scale plot are meaningful. For more details, please see the overview of our 2021 Consumer SSD Benchmark Suite.
 |
|||||||||
At low rates, the mean latency from the Inland Performance Plus is actually higher than the 99th percentile latency, indicating there's a small number of extremely high-latency IOs skewing the average. The median latency starts at a very respectable 63µs, but the highest latency measured at low rates is close to 70ms—three orders of magnitude slower. This looks like the drive might be stalling while waking up from a sleep state, which it shouldn't even be entering given the minimal idle time between test phases. Above 120k IOPS, the 99th percentile latency jumps up to the millisecond range, which should only happen to a drive this high-end when it's pretty close to its maximum throughput. The Performance Plus does achieve respectable throughput that is a clear improvement over the Phison E16, but compared to WD and Samsung flagships the E18 drive is slower and has some mildly concerning performance quirks.


118 Comments
View All Comments
RSAUser - Friday, May 14, 2021 - link
Even then, storage is substantially cheaper than RAM, but it will be interesting to see if e.g. 64-128GB RAM configs will become a more common thing (since 64GB/memory die on DDR5 vs 16GB/die on DDR4).oRAirwolf - Thursday, May 13, 2021 - link
Great article as always. I do wish Anandtech would add some real world performance numbers like Windows load times, game load times, file transfer speeds, etc.jospoortvliet - Friday, May 14, 2021 - link
That is exactly what the trace tests on page 2 are.Spunjji - Friday, May 14, 2021 - link
Those kind of tests aren't going to show any noticeable differences. I'm saying this as someone who has personally messed around with configurations like having 6 SATA 3 SSDs in RAID-0, various flavours of NVMe, etc.mode_13h - Saturday, May 15, 2021 - link
> having 6 SATA 3 SSDs in RAID-0Depends on your controller and how it's connected. I have a fileserver with 3x SATA SSDs in a RAID-5, and my bottleneck is the DMI link.
Spunjji - Monday, May 17, 2021 - link
Sort-of, and sort-of not - you'll get lower performance on devices connected over a chipset link than directly, but in terms of Windows and game load times you're rarely going to see more than single-second differences.For the record, my 6-drive array was connected directly to the CPU via a PCIe 3.0 8x RAID card. It would be handily outperformed by a modern ~1TB NVMe drive, and the RAID BIOS initialization time easily eclipsed the minor difference it made to Windows load times over a single drive. I didn't keep it around for long - it was just a thing I tried because I ended up with a bunch of 256GB SATA SSDs and some spare time.
edzieba - Monday, May 17, 2021 - link
I'd love to see the recent crop of "New Faster PCIe 4.0!" drives be tested on both PCIe 4.0 and PCIe 3.0 (on the same system, just with the bus capped) to control for meaningful improvements i ndrive controller performance vs. meaning improvements from link rate increase.I suspect that the majority of performance gain from new drives is down to using newer controllers, and those without PCIe 4.0 capable boards would see near identical performance.
KarlKastor - Tuesday, May 18, 2021 - link
@Billy TallisCan you please write the NAND manufacturer in the lists? You just write the No of Layers. The difference between Toshiba and Micron NAND were sometimes quite huge in the past.