Intel Beast Canyon NUC Review: Desktop Tiger Lake Debuts in SFF Gaming Powerhouse
by Ganesh T S on July 29, 2021 9:00 AM EST- Posted in
- Systems
- Intel
- NUC
- Tiger Lake
- NUC11
- Beast Canyon
Miscellaneous Performance Metrics
This section looks at some of the other commonly used benchmarks representative of the performance of specific real-world applications.
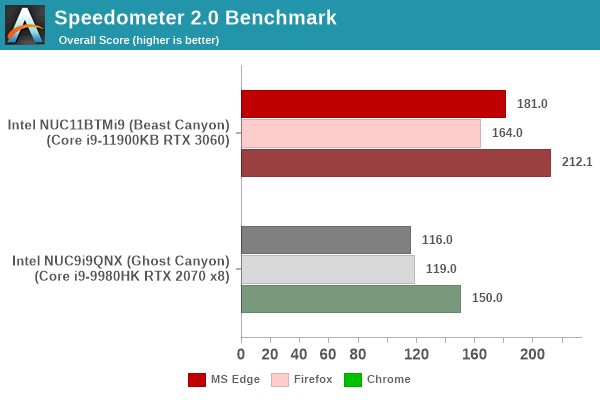
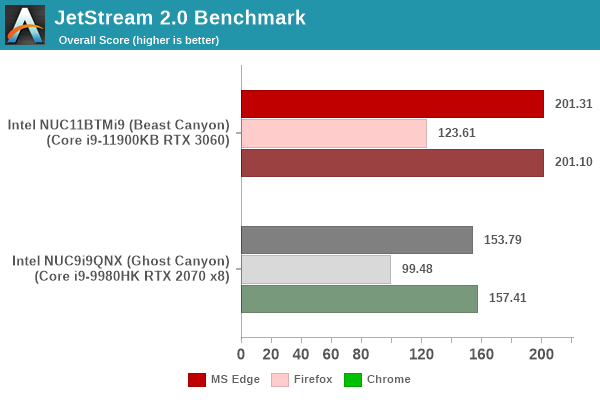
Web Browser Benchmarks - JetStream and Speedometer
Web browser-based workloads have emerged as a major component of the typical home and business PC usage scenarios. Beginning with this review, we are including browser-focused benchmarks from the WebKit developers. Hosted at BrowserBench, JetStream 2.0 benchmarks JavaScript and WebAssembly performance, while Speedometer measures web application responsiveness. We also process MotionMark, but the confidence level of the results vary as much as +/-35%. Hence, we present graphs only the Jetstream 2.0 and Speedometer results for the three top browsers below.
In order to maintain reproducibility, we self-host the BrowserBench benchmarks (git clone of the WebKit repository as on July 1, 2021). The browser versions used for the numbers above are presented in the table included in each system's review.
| Intel NUC11BTMi9 Browser Bench | |||
| Speedometer 2.0 | JetStream 2.0 | MotionMark 1.2 | |
| Microsoft Edge (92.0.902.55) |
181 ± 2.2 | 201.313 | 900.46 ± 14.16% |
| Google Chrome (92.0.4515.107) |
212.1 ± 2.1 | 201.097 | 1115.74 ± 5.54% |
| Mozilla Firefox (90.0.2.7872) |
164 ± 2.2 | 123.612 | 1072.12 ± 3.44% |
BAPCo's SYSmark 25 and UL's PCMark benchmarks both include web browser activities as part of their evaluation scheme. However, the performance for this increasingly important workload tends to get lost in the presentation of a single number. JetStream and Speedometer help us focus on how different PC configurations vary in terms of the user experience with respect to web browsers.
3D Rendering - CINEBENCH R23
We use CINEBENCH R23 for 3D rendering evaluation. R23 provides two benchmark modes - single threaded and multi-threaded. Evaluation of different PC configurations in both supported modes provided us the following results.
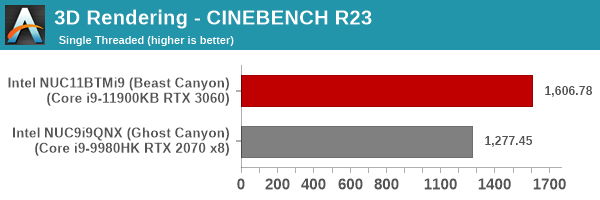
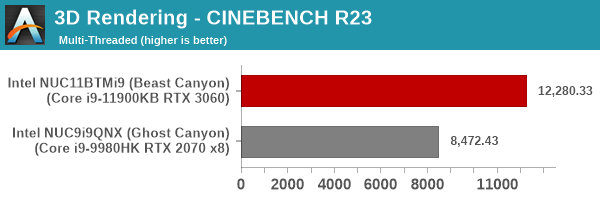
The microarchitectural improvements in Tiger Lake help the Beast Canyon outscore the Ghost Canyon by a significant margin.
x265 Benchmark
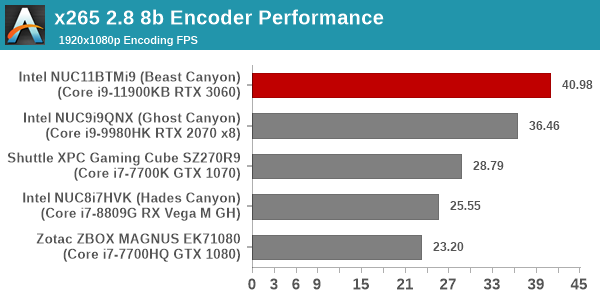
Next up, we have some video encoding benchmarks using x265 v2.8. The appropriate encoder executable is chosen based on the supported CPU features. In the first case, we encode 600 1080p YUV 4:2:0 frames into a 1080p30 HEVC Main-profile compatible video stream at 1 Mbps and record the average number of frames encoded per second.
Our second test case is 1200 4K YUV 4:2:0 frames getting encoded into a 4Kp60 HEVC Main10-profile video stream at 35 Mbps. The encoding FPS is recorded.
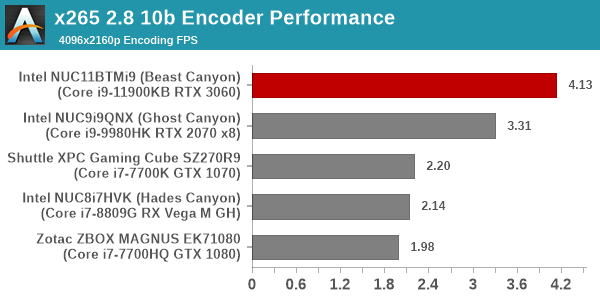
The latest Tiger Lake microarchitecture again helps the Beast Canyon come out on top.
7-Zip
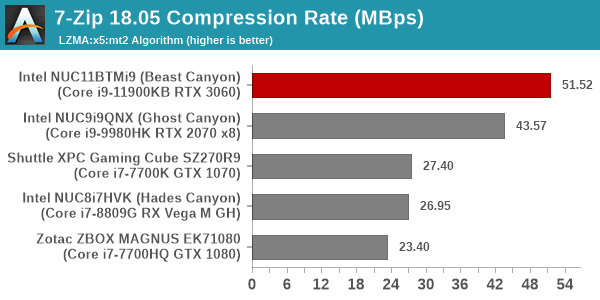
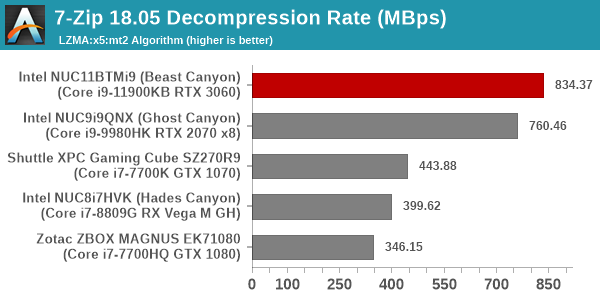
7-Zip is a very effective and efficient compression program, often beating out OpenCL accelerated commercial programs in benchmarks even while using just the CPU power. 7-Zip has a benchmarking program that provides tons of details regarding the underlying CPU's efficiency. In this subsection, we are interested in the compression and decompression rates when utilizing all the available threads for the LZMA algorithm.
Cryptography Benchmarks
Cryptography has become an indispensable part of our interaction with computing systems. Almost all modern systems have some sort of hardware-acceleration for making cryptographic operations faster and more power efficient. In this sub-section, we look at two different real-world applications that may make use of this acceleration.
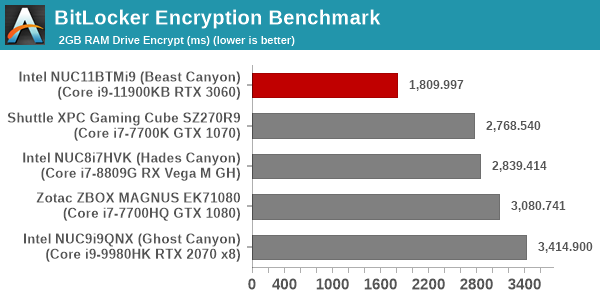
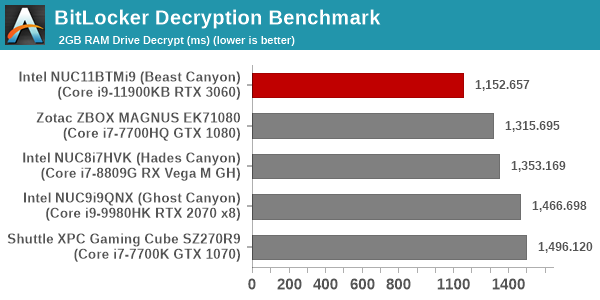
BitLocker is a Windows features that encrypts entire disk volumes. While drives that offer encryption capabilities are dealt with using that feature, most legacy systems and external drives have to use the host system implementation. Windows has no direct benchmark for BitLocker. However, we cooked up a BitLocker operation sequence to determine the adeptness of the system at handling BitLocker operations. We start off with a 2.5GB RAM drive in which a 2GB VHD (virtual hard disk) is created. This VHD is then mounted, and BitLocker is enabled on the volume. Once the BitLocker encryption process gets done, BitLocker is disabled. This triggers a decryption process. The times taken to complete the encryption and decryption are recorded. This process is repeated 25 times, and the average of the last 20 iterations is graphed below.
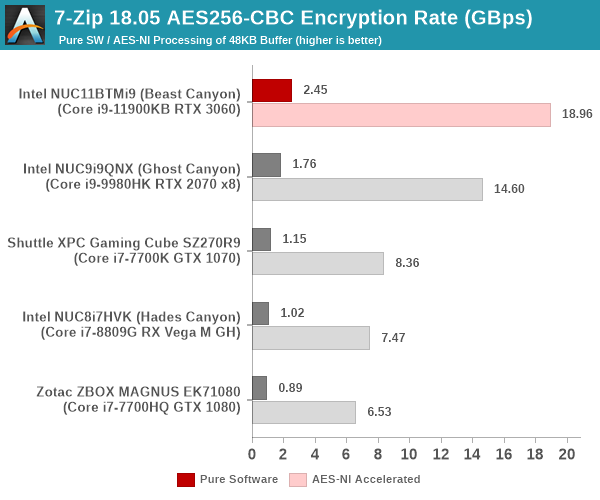
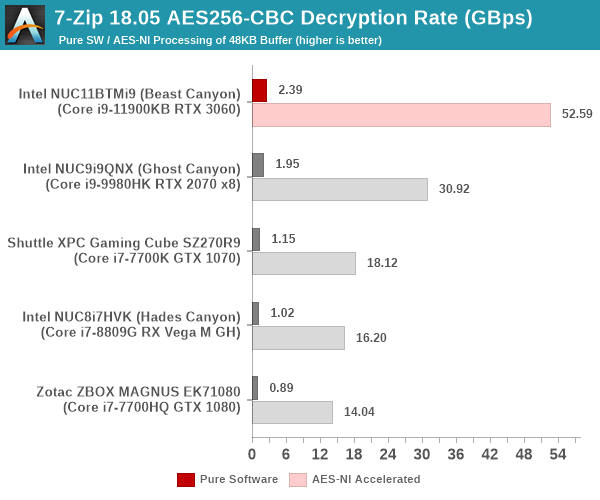
Creation of secure archives is best done through the use of AES-256 as the encryption method while password protecting ZIP files. We re-use the benchmark mode of 7-Zip to determine the AES256-CBC encryption and decryption rates using pure software as well as AES-NI. Note that the 7-Zip benchmark uses a 48KB buffer for this purpose.
Yet another cryptography application is secure network communication. OpenSSL can take advantage of the acceleration provided by the host system to make operations faster. It also has a benchmark mode that can use varying buffer sizes. We recorded the processing rate for a 8KB buffer using the hardware-accelerated AES256-CBC-HAC-SHA1 feature.
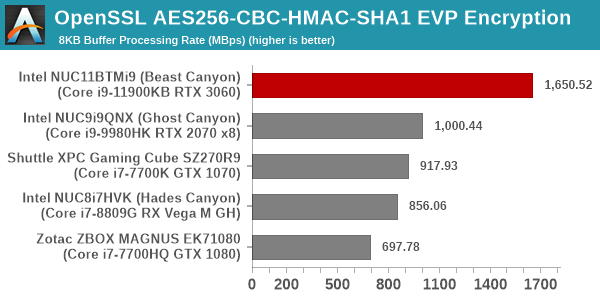

In every cryptography application, the Tiger Lake-based Beast Canyon is the runaway leader.
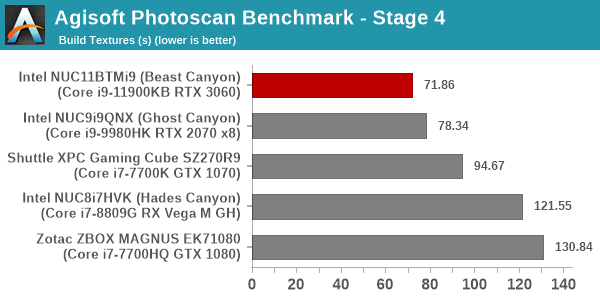
Agisoft Photoscan
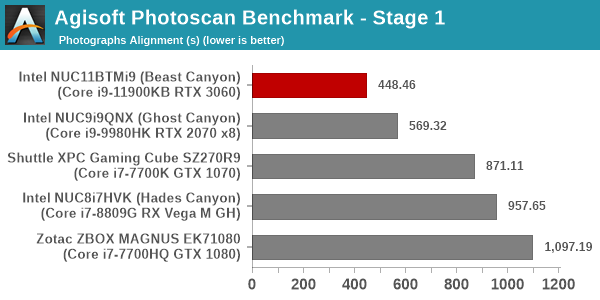
Agisoft PhotoScan is a commercial program that converts 2D images into 3D point maps, meshes and textures. The program designers sent us a command line version in order to evaluate the efficiency of various systems that go under our review scanner. The command line version has two benchmark modes, one using the CPU and the other using both the CPU and GPU (via OpenCL). We present the results from our evaluation using the CPU mode only. The benchmark (v1.3) takes 84 photographs and does four stages of computation:
- Stage 1: Align Photographs (capable of OpenCL acceleration)
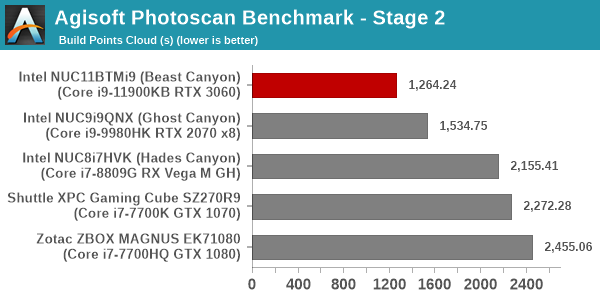
- Stage 2: Build Point Cloud (capable of OpenCL acceleration)
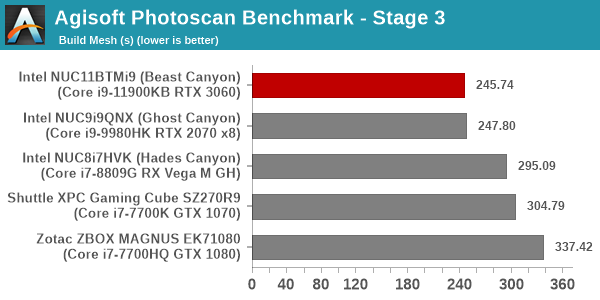
- Stage 3: Build Mesh
- Stage 4: Build Textures
We record the time taken for each stage. Since various elements of the software are single threaded, and others multithreaded, it is interesting to record the effects of CPU generations, speeds, number of cores, and DRAM parameters using this software.
Dolphin Emulator
Wrapping up our application benchmark numbers is the new Dolphin Emulator (v5) benchmark mode results. This is again a test of the CPU capabilities.
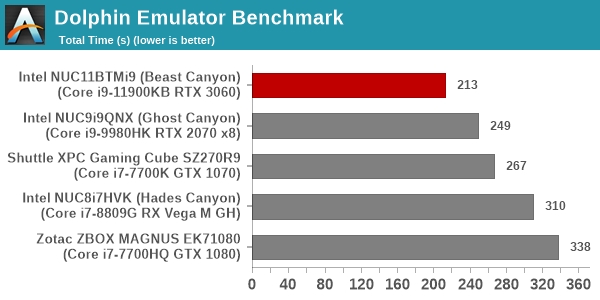
Overall, the CPU capabilities of the Core i9-11900KB with its new Tiger Lake microarchitecture / increased L2+L3 cache help the Beast Canyon NUC handily outwit the other contenders across all the workloads analyzed in this section.


84 Comments
View All Comments
Oxford Guy - Wednesday, August 11, 2021 - link
‘It is likely that the production BIOS will need to sacrifice some noise levels for better thermals.’Haha.
Hixbot - Saturday, August 14, 2021 - link
I point this out on all SFF reviews on this site, but it seems it falls on deaf ears: We need noise measurements and comparisons.(pun intended)
yacoub35 - Saturday, August 21, 2021 - link
Agree - noise measurements please!yacoub35 - Saturday, August 28, 2021 - link
Are the "case" fans on this easily replaceable if they fail?