State of the Part: CPUs
by Jarred Walton on August 5, 2014 8:55 PM EST- Posted in
- Guides
- CPUs
- APUs
- State of the Part
Short Introduction to CPUs and Terminology
There are many elements that go into any modern computer: the CPU/APU, motherboard, memory, (optional) GPU, storage, case, and power supply. While some items like the case and power supply don't usually have an impact on performance, the CPU is one of the core elements and should be carefully selected. The goal today is to give a short overview of the level of performance you can expect across a large selection of CPUs/APUs.
Of course the choice of CPU also limits your choice of motherboard and potentially other components, but that's a topic for another day. Briefly, both AMD and Intel have several current platforms, and each CPU/APU requires a specific class of platform (i.e. a certain CPU/APU socket). AMD currently has the FM2/FM2+ platforms for APUs, with the AM3+ platform being used for CPUs (though AM3+ is mostly being phased out at this stage); Intel has platforms for sockets LGA1150 and LGA2011, with the latter being a higher performance/higher cost "Extreme" platform that borrows quite a bit from Intel's workstation platform (and LGA2011 is set to be replaced by a new platform next month).
Before we go any further, let's take a step back and quickly cover some of the terms we'll be throwing around. CPU stands for Central Processing Unit, and broadly speaking it handles most of the calculations that a modern PC performs in order to do useful work. APU stands for Accelerated Processing Unit, and it's AMD's marketing term for a CPU that also includes a GPU (Graphics Processing Unit), with the distinction being that the GPU portion must be able to perform at a minimum a certain subset of calculations. AMD's APUs all have at least DirectX 11 capabilities, and while Intel now includes DX11 GPUs (called "processor graphics") in most of their CPUs, in general AMD's APUs have faster/better graphics than Intel's CPUs.
Then we come to the processor model numbers. It would be great if higher numbers were universally better, but these days all CPUs/APUs use model numbers that are similar to what you'll find with many other products (e.g. cars). A higher number can mean many things – better performance, more features, lower power, a newer part, etc. – and both AMD and Intel have several families of processors. There are also differences between generations of processors that can have an impact on performance and features, but again this is a topic to address in greater detail elsewhere.
The short summary is that on the Intel side, in order of increasing performance/features the processor families include the Celeron, Pentium, Core i3, Core i5, and Core i7. For AMD, things are a bit easier as their processor models consist of the A4, A6, A8, and A10 APUs, along with FX-series CPUs (i.e. no graphics, though AMD is releasing mobile FX-series APUs now in the laptop market). If you want to know more about the features and specifications of any particular processor, you can use Intel's ARK or AMD's desktop APUs and desktop CPUs.
Comparison of CPU and Graphics Performance
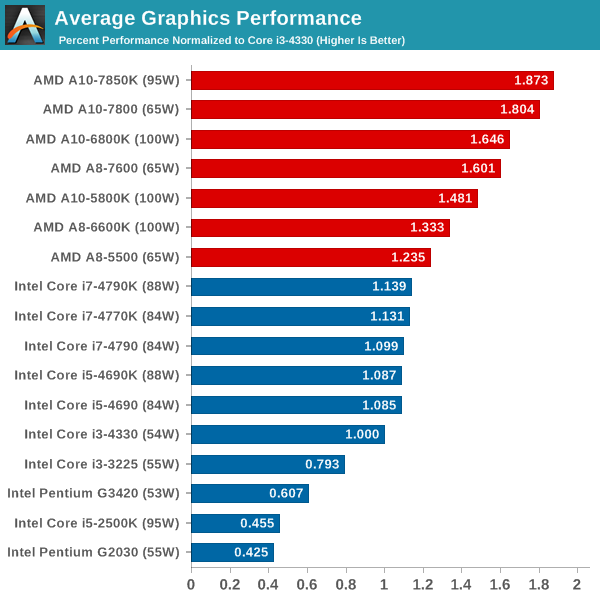
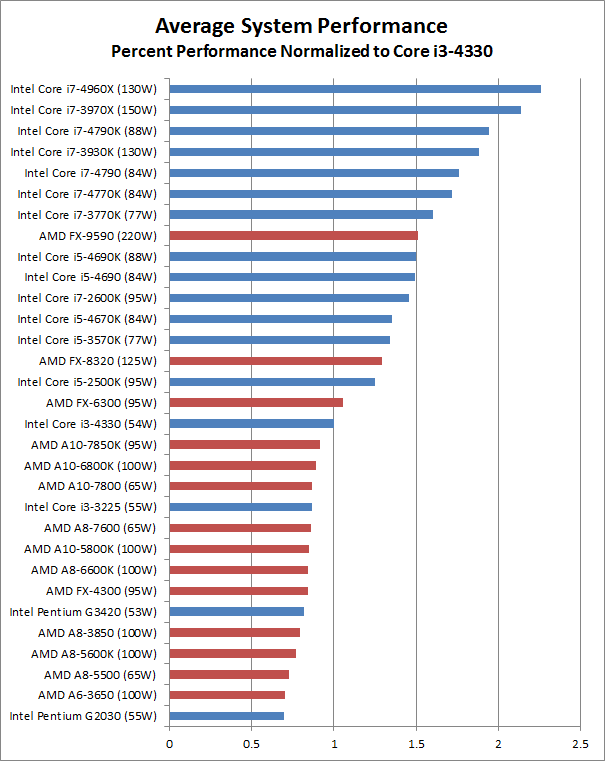
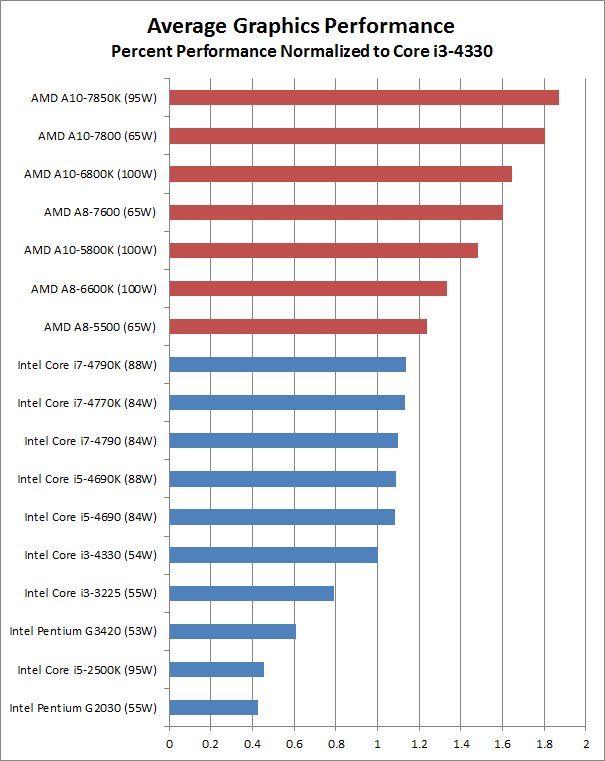
With that introduction out of the way, let's move on to the level of performance you can expect. All of the performance information presented here comes from CPU Bench, but instead of looking at individual charts we have averaged performance across a bunch of tests and normalized the scores relative to Intel's Core i3-4330. Note that not all benchmarks were tested on every processor, but we selected those tests that were run on most configurations; some of the processors (e.g. i5-4670K) that didn't have all the benchmarks run on them thus fall further down the charts than expected. The charts below thus represent a high level abstracted overview of CPU performance. We have also tested the integrated graphics performance where applicable, again normalized relative to i3-4330 performance.
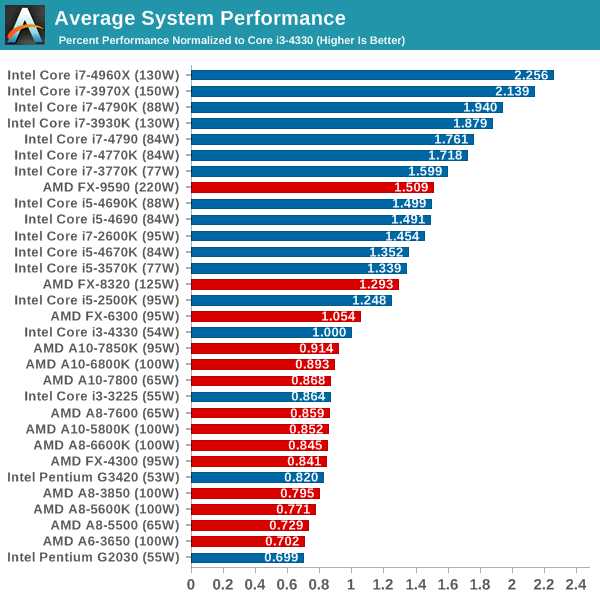
There's a lot of abstraction going on here, naturally, so if you want specifics on benchmark results you'll need to refer to CPU Bench. The benchmarks used include single-threaded and multi-threaded workloads, along with system tests that will hit storage and memory quite a bit (e.g. PCMark 8 and 7-zip); the graphics benchmarks use five games along with two GPU compute tests. While the i7-4960X may not win every benchmark, and likewise the Pentium G2030 may not lose every benchmark, looking at overall relative performance gives us the above results and provides a good baseline recommendation as to which CPUs are the fastest.
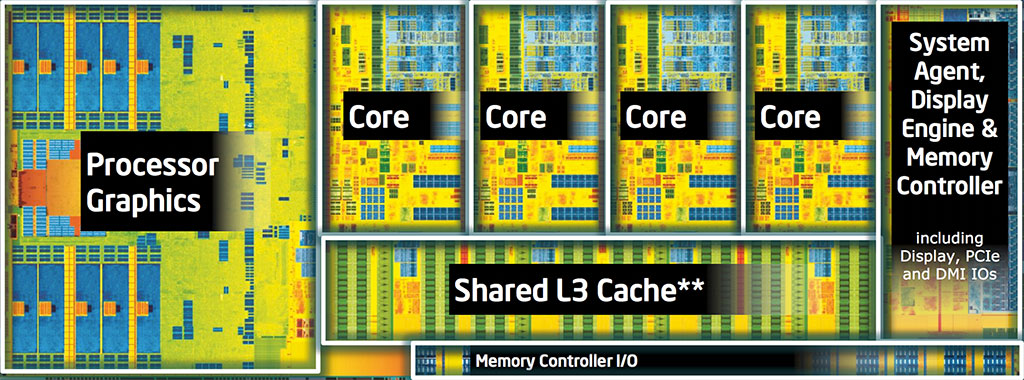
Intel's Haswell GT2 Die
The above graphs are a great picture of the split happening in the world of CPUs/APUs. On the CPU side of the fence, Intel is virtually untouched by AMD. Our reference i3-4330 is faster than all but the fastest AMD processors, and in fact only the AMD CPUs (i.e. not APUs) are able to surpass the overall performance of Intel's i3-4330. Of course we also have to look at what the overall scores really mean, and while the fastest CPUs like the i7-4960X are more than twice as fast as the i3-4330, the slowest CPU included in the charts – the Pentium G2030 – still provides 70% of the performance of the i3-4330. For general use cases like surfing the Internet and watching movies, all of the processors in the above chart should suffice, and other elements like storage often have a bigger impact on the user experience.
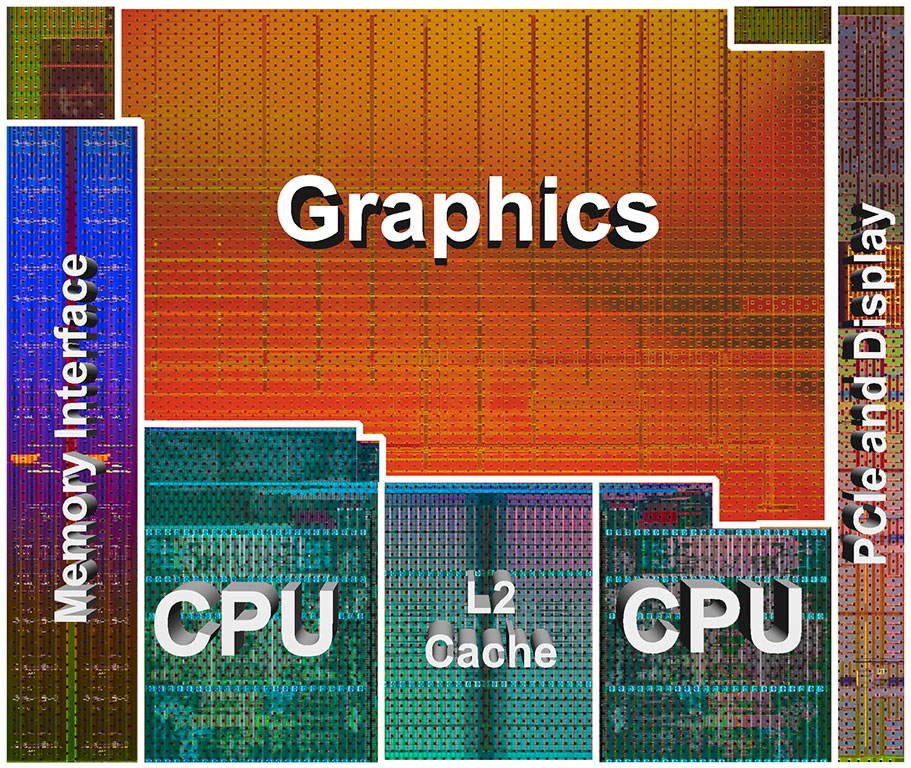
AMD's Kaveri Die
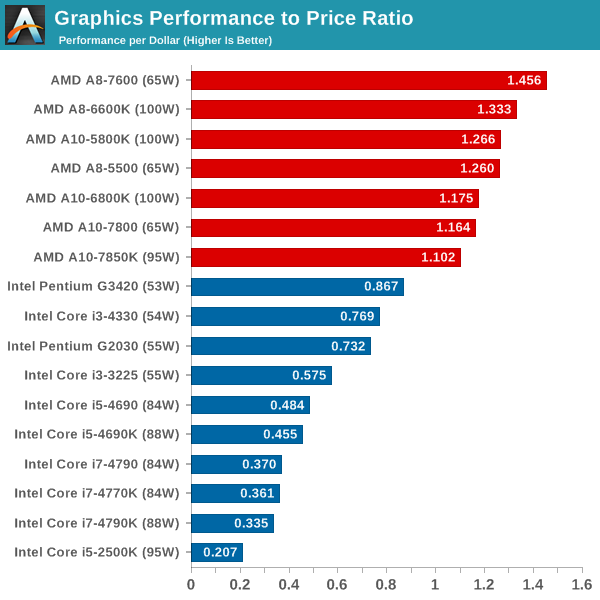
Moving to the graphics chart, the tables are turned and even Intel's fastest graphics solutions (outside of the HD 5000, Iris, and Iris Pro, which we have not includes as they're limited to laptops and OEM systems) are still slower overall than the AMD A8-5500. You can see from the above two die shots that AMD has dedicated a proportionally larger amount of the chip to graphics than Intel has, though Intel's Haswell GT3 parts double the graphics portion and end up being closer to AMD in terms of alloted space, while AMD disables portions of the graphics on their A8 and A6 APUs.
We're missing results from many older/slower processors of course, and adding in even a budget dedicated GPU (i.e. the AMD R7 240 or NVIDIA GT 730) would in most cases deliver better overall performance than even the fastest on-die GPU. While graphics has become more important over time, in practice it's mostly useful for gaming and a few computationally intensive workloads like video and image processing. That could change and GPU performance could become a bigger element of the overall user experience, and that's where AMD is trying to go with their talk about Compute Cores, but currently GPU performance isn't as useful as CPU performance for most tasks.
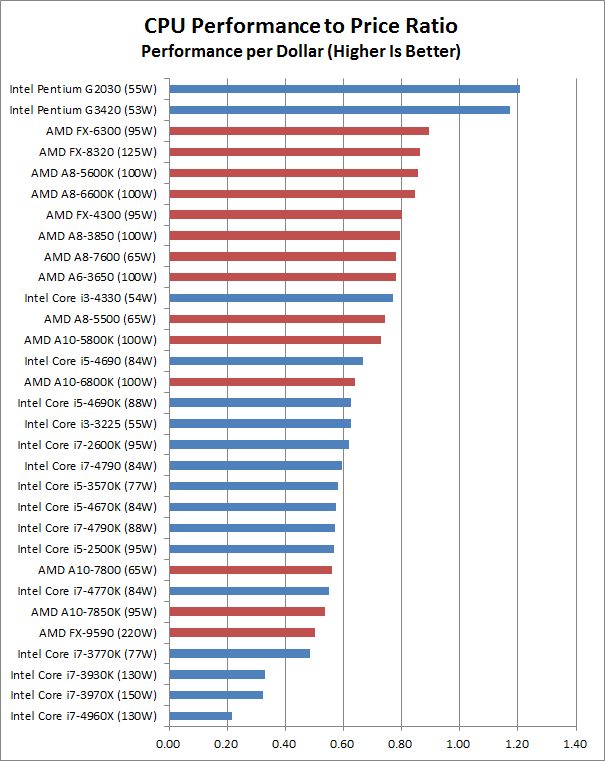
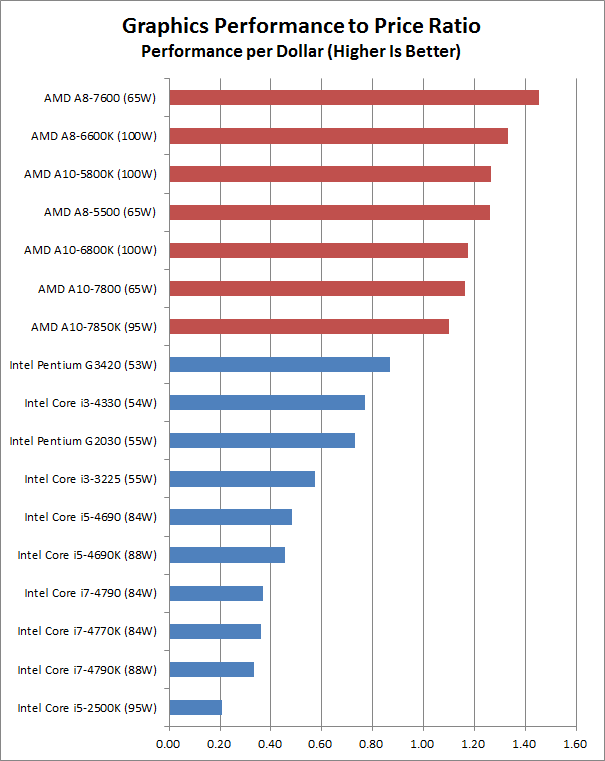
Performance to Price Ratios
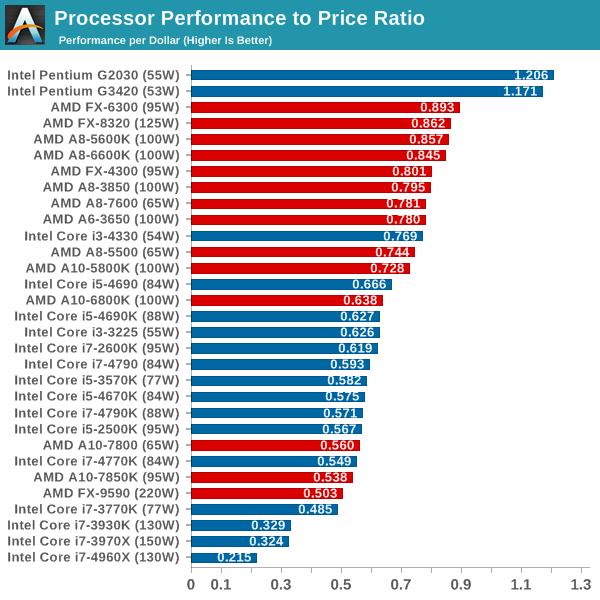
Naturally, there's one other element that needs to be considered: the price of the parts. Intel holds the crown for the fastest CPU performance, but if we just look at the cost of the CPUs/APUs and how much you pay for a certain level of performance the story is quite different. Not surprisingly, the least expensive processors tend to look the best here. However, processors don't exist in a vacuum – they're only a portion of the total system cost – so we really need to add in a baseline price for the rest of a system.
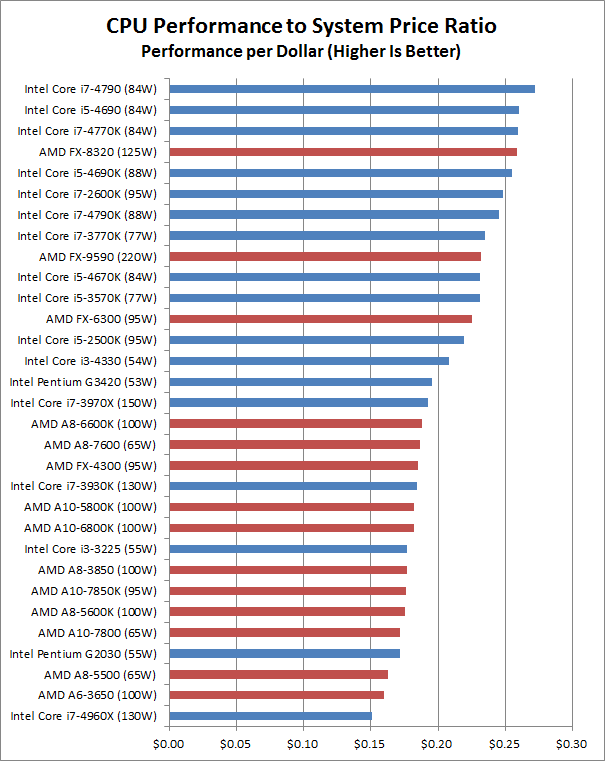
If you purchase a motherboard, RAM, SSD, case, and PSU it will tack on $350-$510. I used the base set of components from the recent Budget PC Guide (minus the HDD), and then chose reasonable motherboards for the various platforms ($75 for FM2/FM2+, $80 for AM3+, $100 for LGA1155, $90 for LGA1150, and $225 for LGA2011 with $10 extra on RAM to get 4x2GB instead of 2x4GB). You could certainly spend a lot more on system components, but while less expensive motherboards exist for some of the platforms, I'm a bit wary of any motherboard priced under $70. The result is that the minimum cost for an entire system ends up being around $425-$500 for the less expensive CPUs/APUs, and $600 for something like the i5-4690K, $670-$705 for Core i7 LGA1150 systems, and as much as $1559 for the i7-4960X. Using the complete system prices (including a $50 discrete GPU on the AM3+ and LGA2011 systems), the performance to price charts look as follows:
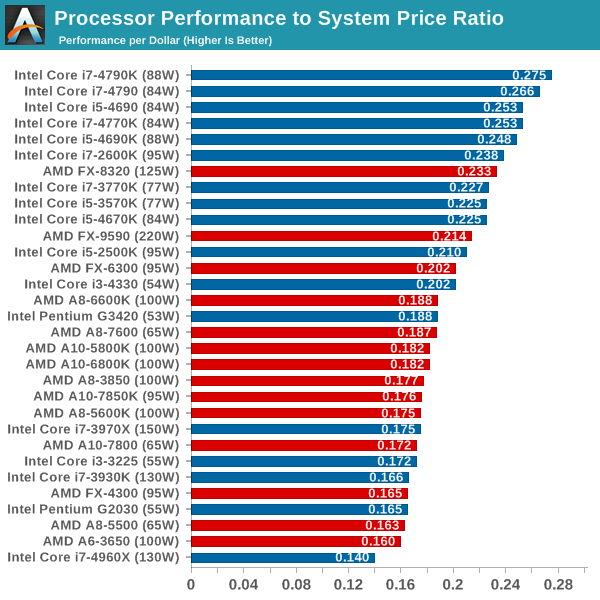
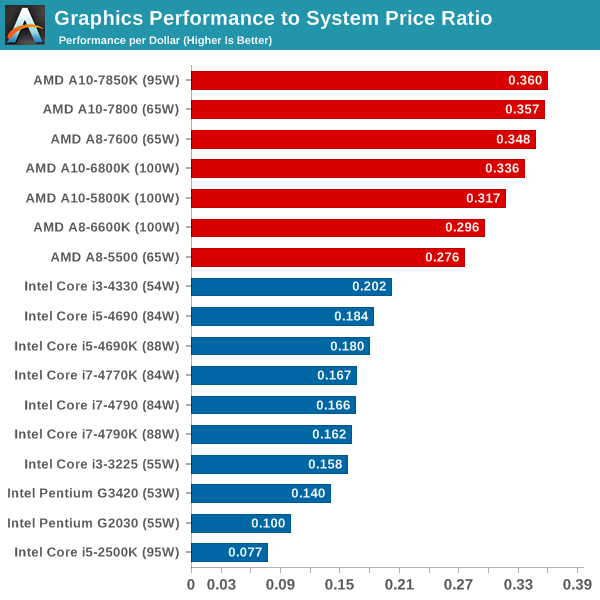
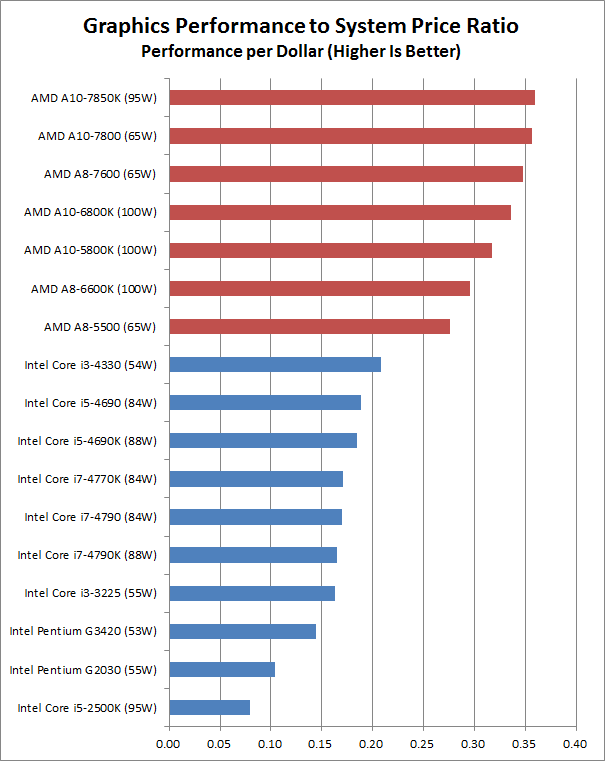
Now we're back to Intel holding on to the top spots, and interestingly it's the more expensive CPUs that take the lead. AMD's FX-8320 makes a decent showing, though the need for a discrete GPU drops it to seventh place overall. The difference in relative value between the best and worst processors becomes far less pronounced, on both the CPU and graphics charts, though AMD continues to lead on graphics performance. (Again, toss in a moderate dedicated GPU and it would be a different story.) We've also left out any consideration of power requirements, which don't necessarily match up with the TDPs we've listed. In general, the latest APUs from AMD (Trinity, Richland, or Kaveri) and the latest CPUs from Intel (Ivy Bridge and Haswell) all have similar idle power draw, so unless you're looking at the AM3+ or LGA2011 platforms power isn't a primary consideration.
If you want a recommendation based on the above information, the short summary is that Intel's latest Haswell CPUs – the i7-4790 and i5-4690 – continue to be my two favorites, with overclockers getting a recommendation to spend a bit more for the Devil's Canyon i7-4790K or i5-4690K. If you're opposed to buying Intel, the price of Kaveri APUs right now is higher than I'd like, and the FX-8320 is still a potent CPU for certain workloads (and it has four modules with eight cores compared to two modules and four cores for the fastest APUs). Even so, unless you specifically need the additional CPU cores, I'm more inclined to go with a Kaveri or Richland APU. The A8-7600 is probably the best balance of performance and price, but if you want the best on-die graphics solution the A10-7800 and A10-7850K are right in the same relative range for relative value.
Update: I modified the charts and improved the system price estimates, and the results are reflected in the above graphs. I also updated the text slightly to reflect these changes. If you want to see the original charts (which had slightly different system price estimates), here are the links: Average CPU Performance, Average Graphics Perfomance, CPU Performance to Price, Graphics Performance to Price, CPU Performance to System Price, and Graphics Performance to System Price.


69 Comments
View All Comments
jjj - Tuesday, August 5, 2014 - link
I am sorry, not sure if this is intentional or you really don't get it. if it is intentional that it shows how deeply corrupted Anadtech is.You are comparing CPU perf to the cost of bananas in Bnagladesh.
You take a 320$ CPU of perf X and do perf per 350$ then you take a 100$ CPU of perf Y and do perf per 350$. You don't include the cost of the CPU at all, you just do perf per cost off all the other parts excluding CPU and that cost is rather random. This is why the only change from perf reanking that does not include price is a penalty for LGA2011.
The result has NOTHING at all to do with cost
I mean,you take a "system cost "of 450$ for a machine where just the CPU is 1k$ instead of factoring in 1450$.
I really hope you correct and republish this because otherwise ,it's just too obvious
SymphonyX7 - Wednesday, August 6, 2014 - link
The only things obvious here are the following:1) You're incapable of cost-benefit analysis if you can't even figure something as simple as the one in this article.
2) You're not clear about what you're trying to get across. What is your point? You just scaled the price of the other components based on the price of the CPU. It's entirely possible to have either a $300 i7-4790 or $60 Pentium G3220 while the rest of the components stay in the $350 range. He's isolating the CPU's performance.
3) You can't even be bothered to proofread. You come in here talking like someone from primary/elementary school.
jjj - Wednesday, August 6, 2014 - link
Yes it is true that i can't be bothered to proof read a comment here when i am way busy at 6 am and after all English is my 3rd language so maybe ii even made some mistakes not just typos but at least my logic is above 3rd grade.You must be very pleased that you got to say cost benefit analysis but if you think this way is reasonable then you clearly need a dictionary.or go Google for it- if we are being rude and all.
With that said he might not have made the mistake i assumed he did but since the article doesn't provide clear numbers and details it seems way off. However the chart is still way off compared to reality and pretty sure it doesn't include a discrete GPU where there is no on die GPU.
It s possible but very unlikely for a 100$ CPU to be paired with 16-32GB of RAM and a 700-1000W PSU and so on, while it is is very likely that a 1k CPU will have a lot more RAM and bigger PSU. A fixed cost for the other parts makes only sense if you try to distort the results. Any reasonable system guide provides a balanced system at a certain budget. If Anandtech was Intel's marketing team it would be ok , we are used with such tricks but it would be nice to a different behavior.
JarredWalton - Wednesday, August 6, 2014 - link
The performance relative to system cost was scaled as I stated in the article: the base cost of the system was estimated at $350 for all of the systems except for LGA2011, which was estimated at $450 (thanks to the more expensive motherboards). Add to that cost the price of the CPU, so the Extreme CPUs end up priced around $800-$1500 for the complete system while the budget CPUs end up priced around $400-$500 for the complete system.I'm sorry if that wasn't entirely clear in the article, but this was intended as more of an introduction and overview than an in-depth look at every facet of CPUs. It's for people that say, "Hey, if I'm looking at a new system, what's the best bang for the buck and roughly how much faster is chip X compared to chip Y?" We already have plenty of lengthier content, so this sort of article is designed to cater to a wider audience.
As far as the inclusion of discrete GPUs, the data comes from CPU Bench so everything obviously has to have some sort of GPU. In the case of CPUs that don't have on-die graphics, I believe Ian uses an entry level GPU like an HD 7450 similar. Most of the CPU-centric tests don't hit the GPU much, so as long as we're not throwing in a high-end GPU the overall performance should be consistent. We do not have any performance figures for discrete GPUs in our graphics section of test -- at least not that I used (there are SLI and CF numbers, but not with all systems and that would be more of a look at GPU performance than CPUs).
Finally, regarding what sort of system a person would build, of course most people buying a high-end CPU aren't going to use low cost parts elsewhere, but if we then scale the supposed cost of a system by what parts it might use -- "No one would use a 128GB SSD with an i7-4960X; let's equip that system with two 512GB SSDs in RAID 0!" -- we run into a completely different problem. We have to use a baseline cost somewhere if we are to estimate performance/price for a CPU, and I'd argue strongly that using the minimum reasonable cost is a far better choice than going with a higher spec system. If we did the latter, who would actually use a 512GB SSD and a GTX Titan Z with an A6 APU or Pentium CPU? The reverse (using a high-end CPU with a moderate SSD) is far more likely -- there are compute workstations that I've used that do exactly that.
Hope that helps clarify things.
teiglin - Wednesday, August 6, 2014 - link
FWIW, Jarred, I thought your value analysis was clear and completely agree that you did things in a reasonable way (not to say that there aren't other reasonable ways, but you can only do so much in a short form article). Obviously people have to make their own personal decisions based on the systems they're looking at, but even as someone who has been building his own computers for almost 20 years now, I still found this a good read and will definitely point newer builders here for easy reference. Thanks!dananski - Wednesday, August 6, 2014 - link
I agree. It seemed obvious why the minimum total build price for each cpu was considered, and why it would result in the dramatic reordering of relative value - I don't think Jarred really needed to spell it out, but maybe something got lost in translation for jjj.Cool article.
Flunk - Wednesday, August 6, 2014 - link
I think Symphony is right, your logic is flawed. The very idea that anyone could be comparing the chips means that you can isolate other system costs. If they were to prepare a chart with totally different system configurations for each system it would be totally useless.Anandtech is sponsored by AMD so I don't understand why you think they're favouring Intel. The truth here is that AMDs chips are not competitive in CPU performance
seapeople - Wednesday, August 6, 2014 - link
Actually, Anandtech is sponsored mostly by Third World Press, and that's why they use so much descriptive poetry in their reviews. It also explains the heavy bias against E-Readers, since Third World Press wants to covertly steer electronic customers toward their papial regime rather than the e-readial consumption mechanism.HanzNFranzen - Wednesday, August 6, 2014 - link
yeesssss YEESSSS.... Jarred is CORRUPT.. and DRUNK with POWWWWERR! The next stop? THE WORLD!!! Mmmmuuuuahahahahaha!!! And you caught him jjj, the readers are forever in your debt!I thought it was a great article and very informative. I really liked the charts that showed direct comparisons of system performance relative to the i3 (cpu and graphics) I mean, we already knew that Intel had a cpu advantage and AMD had the graphical advantage, but it is really nice to see just how much of a difference there is between multiple processors (and even intel to intel/amd to amd comparison) all in one chart. Thank you for the write up, and please let me know if you're in need of a side kick on your quest for world domination, as every super villain needs one.
jjj - Wednesday, August 6, 2014 - link
Anandtech is corrupt ,the question is how much. It's not all that obvious but it's there.Just accepting to publish sponsored posts is corruption and compromises it's integrity (just because everybody is doing it doesn't mean it's acceptable). Today we have seen benchmarks for a Snapdragon 805 device and ofc the devices it was compared to were hand picked to exclude some key competitors.
Often Anandtech looks at a certain technology but only talks with one provider of that technology about it, ignoring the competition and basically just advertising that one provider.. Sometimes certain benchmarks are ignored because that particular product doesn't do well there.
But mostly it's about what the product reviewed is compared against and small tricks to make it look good. And when was the last time a review here didn't had a conclusion that was overall positive and when was the last time certain companies had a negative conclusion to a review?
How about Asus, any Asus product gets it's own news item and there are lots of Asus reviews while lots of lots of products that are far more relevant don't even get mentioned.Intel is similar and when AMD started paying for it's own section it started getting far more extensive coverage.
I doubt it's about money , it's most likely more about getting access but that doesn't make it ok.
So yes , without any doubt Anandtech is not objective and it's been going downhill for some years now, why it's less and less reliable , that's hard to say for sure.