The AMD A8-7650K APU Review, Also New Testing Methodology
by Ian Cutress on May 12, 2015 10:00 AM ESTNew Testing Methodology
Every twelve to eighteen months it makes sense to upgrade our test beds in order to best represent what is available on the market. How the upgrade occurs depends on what is being tested, and in the case of our APU reviews it is clear that due to the wide range of graphics options available, as well as at different price points, that we have to adjust our gaming testing.
For 2015 our CPU performance testing regime remains untouched aside from the late 2014 addition of Linux-Bench for a glimpse into Linux based performance. On the gaming side, our games have been updated to the following:
- Alien Isolation (First Person Survival-Horror)
- Total War: Attila (Strategy)
- Grand Theft Auto V (Open World Sandbox)
- GRID: Autosport (Driving)
- Middle-Earth: Shadows of Mordor (Action-Adventure)
Because budgets for gaming graphics cards can vary, or users decide to keep the same card for several generations, we will be testing each of these titles in both low, medium and high end graphics setups. This means we can see where the bottlenecks are for CPU performance at each stage. We have also been able to source both AMD and NVIDIA cards for most of these areas, should one side of the equation scale more than the other.
The GPU sections are split into three based on where they fit in their independent stacks rather than for direct competition:
Low-end:
- Integrated Graphics
- ASUS R7 240 2GB DDR3 ($70)
- Dual Graphics (where applicable)
Mid-range:
- MSI GTX 770 Lightning 2GB ($245-$255 on eBay/Amazon, $330 new)
- MSI R9 285 Gaming 2GB ($240)
High-end:
- ASUS GTX 980 Strix 4GB ($560)
- MSI R9 290X Gaming LE 4GB ($380)
On the low end, we have selected settings in order to make the current best integrated graphics solutions score between 45 and 60 frames per second. On the mid-range and high-end, we typically pull out 1080p maximum settings or almost-maximum.
The Shadows of Mordor (SoM) benchmark throws up a little interesting teaser as well due to the use of its Dynamic Super Resolution technique. This allows us to render at 3840x2160 (Ultra-HD, or ‘4K’) with our settings despite using a 1080p monitor. As a result, we also test SoM at 4K ultra with our mid-range and high-end graphics setups.
For the high-end setups, as we have managed to source 2 cards of each, means that where applicable we can test both SLI and Crossfire setups. We apply this to Shadows of Mordor at 4K as an extra data point.
For clarity, this means:
| Integrated R7 240 2GB Dual Graphics |
GTX 770 2GB R9 285 2GB |
GTX 980 4GB R9 290X 4GB |
|
| Alien Isolation | 720p Ultra | 1080p Ultra | 1080p Ultra |
| Average Frame Rate | Average Frame Rate | Average Frame Rate | |
| Total War: Attila | 720p Performance | 1080p Quality | 1080p Quality |
| Average Frame Rate | Average Frame Rate | Average Frame Rate | |
| Grand Theft Auto V | 720p Low | 1080p Very High | 1080p Very High |
| Average Frame Rate %FPS <60 FPS |
Average Frame Rate %FPS <60 FPS |
Average Frame Rate %FPS <60 FPS |
|
| GRID: Autosport | 1080p Medium | 1080p Ultra | 1080p Ultra |
| Average Frame Rate Minimum Frame Rate |
Average Frame Rate Minimum Frame Rate |
Average Frame Rate Minimum Frame Rate |
|
| Middle-Earth: Shadows of Mordor |
720p Low |
1080p Ultra 4K Ultra |
1080p Ultra 4K Ultra 4K SLI/CFX |
| Average Frame Rate Minimum Frame Rate |
Average Frame Rate Minimum Frame Rate |
Average Frame Rate Minimum Frame Rate |
For drivers, we locked down the 350.12 WHQL versions from NVIDIA soon after the launch of GTA V. Similarly, the 15.4 Beta drivers from AMD are also being used. These will remain consistent over the next 12-18 months until the next update.
All of our old (and new) benchmark data, both for CPU and graphics performance, can be found in our benchmark database, Bench.
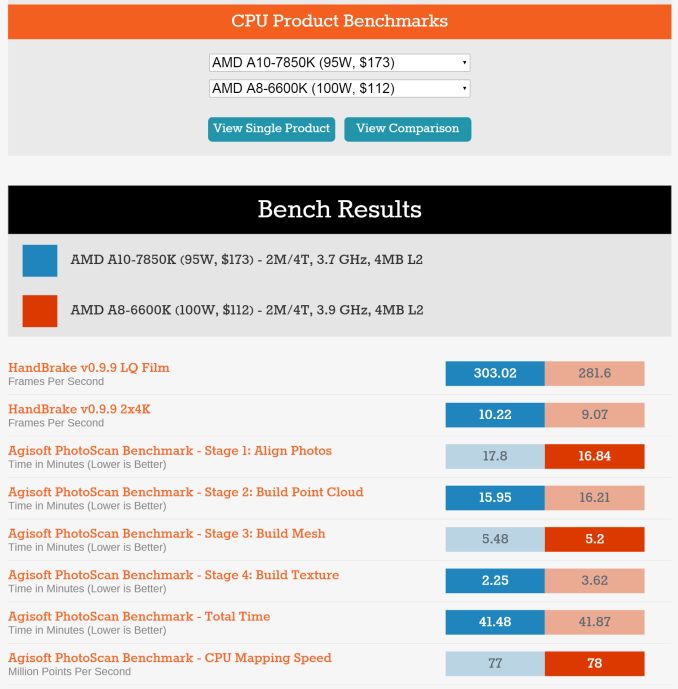
We have a variety of benchmarks here, including legacy benchmarks such as CineBench 11.5 and TrueCrypt, which are not published in the main review. All CPUs/APUs that have been tested in our new 2015 style will be labeled in the dropdown menus by having its launch price listed, e.g. ’AMD A10-7850K (95W, $173)’. With any luck over the course of the next six months we will be adding new data and re-testing older processors for the database in order for our readers to compare old with new.


177 Comments
View All Comments
evolucion8 - Wednesday, May 13, 2015 - link
Actually the R9 280/280X have a 384-Bit BUS and their memory is clocked higher. That is why they offer around 288GB/s for it alone while the PS4 has 176GB/s shared for the system including RAM/BUS/CPU/GPU operations.Edens_Remorse - Wednesday, May 27, 2015 - link
/slow clapevolucion8 - Friday, October 16, 2015 - link
280/280X actually has a 384-Bit BUS.DevilSlayerWizard - Wednesday, May 13, 2015 - link
Every one of those 8 cores are a big joke compared to even Nehalem.silverblue - Wednesday, May 13, 2015 - link
...and this says you're telling porkies, for the most part:http://anandtech.com/bench/product/697?vs=47
Changed the 47 to a 100 for the 950, and to 45 for the 965 Extreme. Remember that these are 8-thread, triple channel CPUs.
nikaldro - Thursday, May 14, 2015 - link
Mmmm hellooooo? You actually believe that 8 Jaguar cores can even remotely be compared to any decent desktop class cpu?Kraelic - Thursday, May 14, 2015 - link
Those older generation discontinued Intel at 3 GHz trade blows with a current 4GHz AMD. Do you not get the joke?redraider89 - Tuesday, May 19, 2015 - link
That's not what he said. Who knows what he means. AMD's comment about what? Poached eggs? Like I said, stupid.yannigr2 - Tuesday, May 12, 2015 - link
56 comments.yannigr2 - Wednesday, May 13, 2015 - link
108 comments.