The Mobile CPU Core-Count Debate: Analyzing The Real World
by Andrei Frumusanu on September 1, 2015 8:00 AM EST- Posted in
- Smartphones
- CPUs
- Mobile
- SoCs
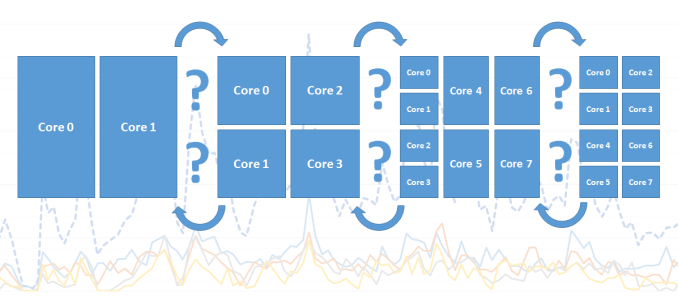
Over the last 5 years the mobile space has seen a dramatic change in terms of performance of smartphone and tablet SoCs. The industry has seen a move from single-core to dual-core to quad-core processors to today’s heterogeneous 6-10 core designs. This was a natural evolution similar to what the PC space has seen in the last decade, but only in a much more accelerated pace. While ILP (Instruction-level parallelism) has certainly also gone up with each new processor architecture, with designs such as ARM’s Cortex A15 or Apple’s Cyclone processor cores brining significant single-threaded performance boosts, it’s the increase of CPU cores that has brought the most simple way of increasing overall computing power.
This increasing of CPU cores brought up many discussions about just how much sense such designs make in real-world usages. I can still remember when the first quad-cores were introduced that users were arguing the benefit of 4 cores in mobile workloads and that these increases were just done for the sake of marketing. I can draw parallels between those discussions from a few years ago and today’s arguments about 6 to 10-core SoCs based on big.LITTLE.
While there have been some attempts to analyse the core-count debate, I was never really satisfied with the methodology and results of these pieces. The existing tools for monitoring CPUs just don’t cut it when it comes to accurately analysing the fine-grained events that dictate the management of multi-core and heterogeneous CPUs. To try to finally have a proper analysis of the situation, for this article, I’ve tried to approach this issue from the ground up in an orderly and correct manner, and not relying on any third-party tools.
Methodology Explained
I should start with a disclaimer that because the tools required for such an analysis rely heavily on the Linux kernel, that this analysis is constrained to the behaviour of Android devices and doesn't necessarily represent the behaviour of devices on other operating systems, in particular Apple's iOS. As such, any comparisons between such SoCs should be limited to purely to theoretical scenarios where a given CPU configuration would be running Android.
The Basics: Frequency
Traditionally when wanting to log what the CPU is doing, most users would think of looking at the frequency which it is currently running at. Usually this gives a rough idea to see if there is some load on the CPU and when it kicks into high gear. The issue with this is the way one captures the frequency: the readout sample will always be a single discrete value at a given point in time. To be able to accurately get a good representation of the frequency one would need to have a sample rate of at least twice as fast as the CPU’s DVFS mechanism. Mobile SoCs now can switch frequency at intervals of down to 10-20ms, and even have unpredictable finer-grained switches which can be caused by QoS (Quality of Service) requests.
Sampling at anything under half the DVFS switching speeds can lead to inaccurate data. For example this can happen in periodic short high bursts. Take a given sample rate of 1s: Imagine that we read frequency out at 0.1s and 1.1s in time. Frequency at both these readouts would be either at a high or low frequency. What happens in-between though is not captured, and due to the switching speed being so high, we can miss out on 90%+ of the true frequency behaviour of the CPU.
Instead of going the route of logging the discrete frequency at a very high rate, we can do something far more accurate: Log the cumulative residency time for each frequency on each readout. Since Android devices run on the Linux kernel, we have easy access to this statistic provided by the CPUFreq framework. The time-in-state statistics are always accurate because they are incremented by the kernel driver asynchronously at each frequency change. So by calculating the deltas between each readout, we end up with an accurate frequency distribution within the period between our readouts.
What we end up is a stacked time distribution graph such as this:
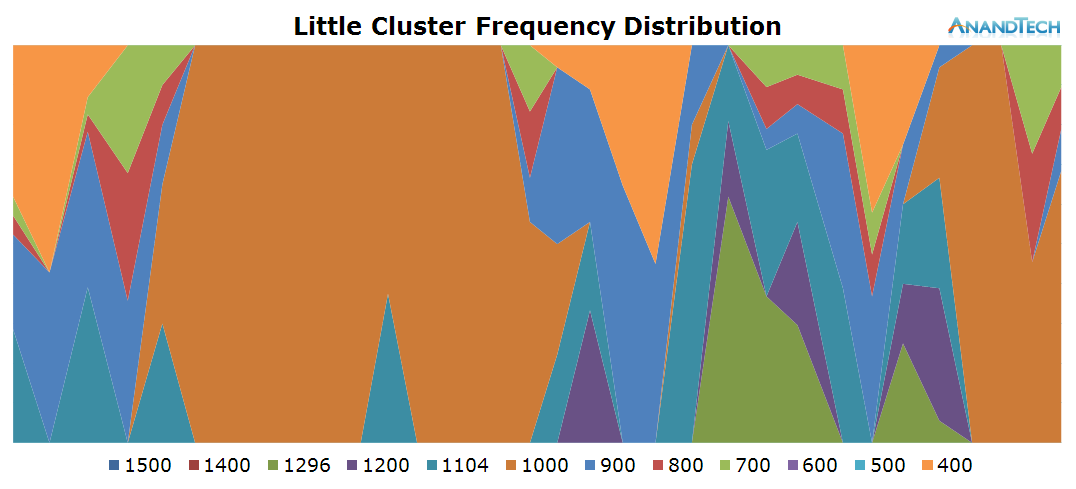
The Y-axis of the graph is a stacked percentage of each CPU’s frequency state. The X-axis represents the distribution in time, always depending on the scenario’s length. For readability’s sake in this article, I chose an effective ~200ms sample period (Due to overhead on scripting and time-keeping mechanisms, this is just a rough target) which should give enough resolution for a good graphical representation of the CPU’s frequency behaviour.
With this, we now have the first part of our tools to accurately analyse the SoC’s behaviour: frequency.
The Details: Power States
While frequency is one of the first metrics that comes to mind when trying to monitor a CPU’s behaviour, there’s a whole other hidden layer that rarely gets exposure: CPU idle states. For readers looking for a more in-depth explanation of how CPUIdle works, I’ve touched upon it and power management of modern SoCs in general work in our deep dive of the Exynos 7420. These explanations are valid for basically all of today's SoCs based on ARM CPU IP, so it applies to SoCs from MediaTek and ARM-based Qualcomm chipsets as well.
To keep things short, a simplified explanation is that beyond frequency, modern CPUs are able to save power by entering idle states that either turn off the clock or the power to the individual CPU cores. At this point we’re talking about switching times of ~500µs to +5ms. It is rare to find SoC vendors expose APIs for live readout of the power states of the CPUs, so this is a statistic one couldn’t even realistically log via discrete readouts. Luckily CPU idle states are still arbitrated by the kernel, which again, similarly to the CPUFreq framework, provides us aggregate time-in-state statistics for each power state on each CPU.
This is an important distinction to make in today’s ARM CPU cores as (except for Qualcomm’s Krait architecture) all CPUs within a cluster run on the same synchronous frequency plane. So while one CPU can be reported to be running at a high frequency, this doesn’t really tell us what it’s doing and could as well be fully power-gated while sitting idle.
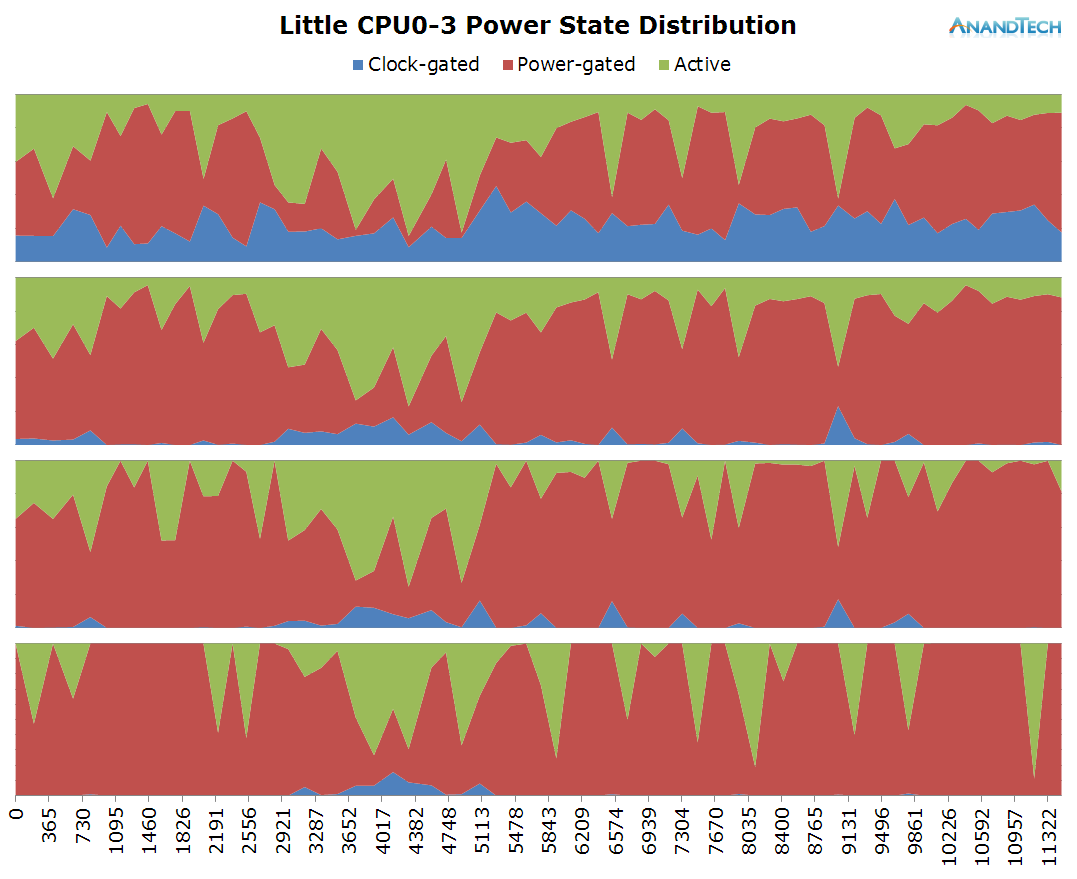
Using the same method as for frequency logging, we end up with an idle power-state stacked time-distribution graph for all cores within a cluster. I’ve labelled the states as “Clock-gated”, “Power-gated” and “Active” which in technical terms they represent the WFI (Wait-For-Interrupt) C1, power-collapse C2 idle states, as well as the difference in time to the wall-clock which represents the “active” time in which the CPU isn’t in any power-saving state.
The Intricacies: Scheduler Run-Queue Depths
One metric I don’t think that was ever discussed in the context of mobile is the depth of the CPU’s run-queue. In the Linux kernel scheduler the run-queue is a list of processes (The actual implementation involves a red-black tree) currently residing on that CPU. This is at the core of the preemptive scheduling nature of the CFS (Completely Fair Scheduler) process scheduler in the Linux kernel. When multiple processes run on the same CPU the scheduler is in charge to fairly distribute processing time between each thread based on time-slices and process priority.
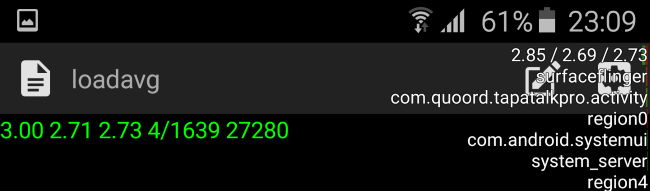
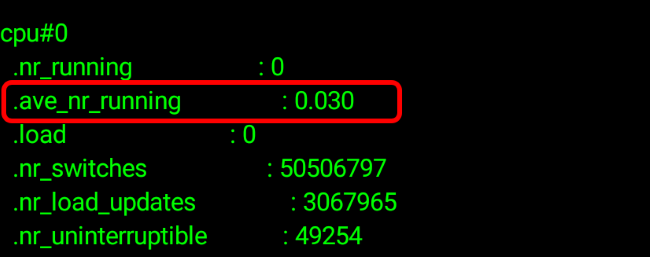
The kernel and Android are able to sort of expose information on the run-queue through one of the kernel’s sysfs nodes. On Android this can be enabled through the “Show CPU Usage” option in the developer options. This gives you three numerical parameters as well as a list of the read-out active processes. The numerical value is the so-called “load average” of the scheduler. It represents the load of the whole system – and it can be used to read how many threads in a system are used. The three values represent averages for different time-windows: 1 minute, 5 minutes and 15 minutes. The actual value is a percentage – so for example 2.85 represents 285%. How this is meant to be interpreted is that if we were to consolidate all processes in as little CPUs as possible we theoretically have two CPUs whose load is 100% (summing up to 200%) as well as a third up to 85% load.
Now this is very odd, how can the phone be fully using almost 3 cores while I was doing nothing more than idling on the screen with the CPU statistics on? Sadly the kernel scheduler suffers from the same sampling rate issue as explained in our frequency logging methodology. Truth is that the load average statistic is only a snapshot of the scheduler’s run-queues which is updated only in 5-second intervals and the represented value is a calculated load based on the time between snapshots. Unfortunately this statistic is extremely misleading and in no way represents the actual situation of the run-queues. On Qualcomm devices this statistic is even more misleading as it can show load-averages of up to 12 in idle situations. Ultimately, this means it’s basically impossible to get accurate RQ-depth statistics on stock devices.
Luckily, I stumbled upon the same issue a few years ago and was aware of a patch that I previously used in the past and which was authored by Nvidia which introduces detailed rq-depth statistics. This tracks the run-queues accurately and atomically each time a process enters or leaves a run-queue, enabling it to expose a sliding-window average of the run-queue depth of each CPU over the period of 134ms.
Now we have a live pollable average for the scheduler’s run-queues and we can fully log the exact amount of threads run on the system.
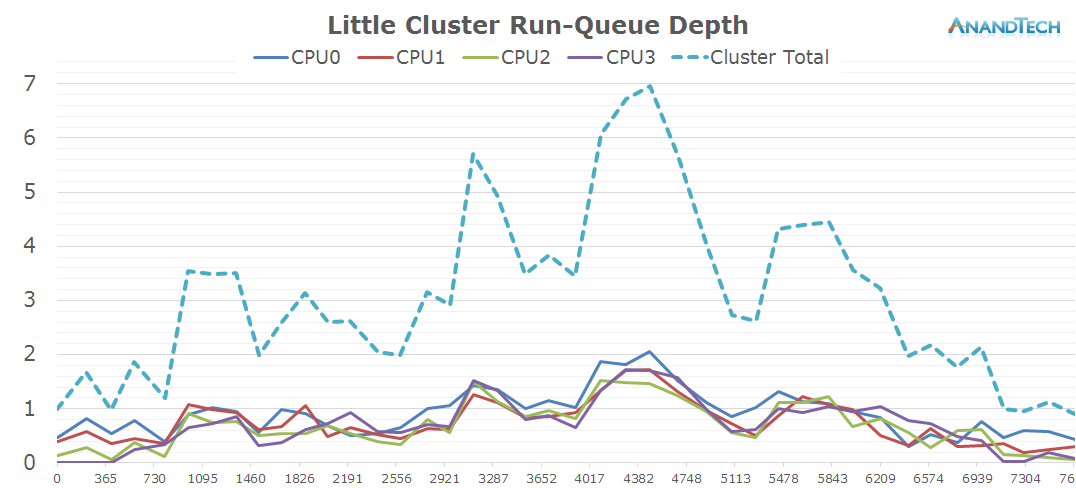
Again, the X-axis throughout the graphs represent the time in milliseconds. This time the Y-axis represents the rq-depth of each CPU. I also included the sum of the rq-depths of all CPUs in a cluster as well the sum of both clusters for the system total in a separate graph.
The values can be interpreted similarly to the load-average metrics, only this time we have a separate value for each CPU. A run-queue depth of 1 means the CPU is loaded 100% of the time, 0.2 means the CPU is loaded by only 20%. Now the interesting metric comes for values above 1: For anything above a rq-depth of 1 it means that the CPU is preempting between multiple processes which cumulatively exceed the processing power of that CPU. For example in the above graph we have some per-CPU peaks of ~2. It means the CPU has at least two threads on that CPU and they each share 50% of the compute-time of that CPU, i.e. they’re running at half speed.
The Data And The Goals
On the following pages we’ll have a look at about 20 different real-world often encountered use-cases where we monitor CPU frequency, power states and scheduler run-queues. What we are looking for specifically is the run-queue depth spikes for each scenario to see just how many threads are spawned during the various scenarios.
The tests are run on Samsung's Galaxy S6 with the Exynos 7420 (4x Cortex A57 @ 2.1GHz + 4x Cortex A53 @ 1.5GHz) which should serve well as a representation of similar flagship devices sold in 2015 and beyond.
Depending on the use-cases, we'll see just how many of the cores on today's many-core big.LITTLE systems are used. Together with having power management data on both clusters, we'll also see just how much sense heterogeneous processing makes and just how much benefit one can gain from it.


157 Comments
View All Comments
lilmoe - Tuesday, September 1, 2015 - link
"we're seeing what or how windows & the x86 platform has stagnated"Your argument is highly inaccurate and extremely dated. This isn't Windows XP era anymore... Windows 10 and 10 Mobile might as well be better than Android in what you're giving kudos to Google for (which they've somewhat managed after YEARS of promises). There's still a huge chunk of overhead in Android's rendering pipeline that needs serious attention. Android has made huge improvements, yes, but there still lots of work that needs to be done.
@Impulses has a good point too; It's extremely difficult to get a fair apples-to-apples comparison when it comes to optimal handling of workloads for varying thermal limits. CPUs at ~2W TDP behave VERY differently from those at 15W, and both behave yet differently from those running at 37W+. This becomes evident when middle ground ~5W mobile CPUs are in the picture, like Intel's Core M, where devices running those are showing no better battery life than their 15W counterparts running the same OS. (Windows 10 is changing that, however, and is showing extreme battery savings in these lower TDPs, more so than the improvements in higher TDP parts, which tells a lot about W10).
If that isn't clear enough already, read the article again. The author CLEARLY mentions in the first page not to make the mistake of applying the aforementioned metrics to other platforms and operating systems, and to strictly stick with Android and big.LITTLE.
Alexvrb - Tuesday, September 1, 2015 - link
Thank you lilmoe and name99! I read his comment and I was like really? These results don't support his claims and were never intended to compare platforms - as specifically stated by the author.R0H1T - Thursday, September 3, 2015 - link
XP to win10 took what a decade & a half? Vista was the last major change, after XP, DX10 & UAC, with win7 then win8 & now win10 bringing only incremental updates. Yeah I call that slow & we've had quad cores since what nearly a decade now, even then a vast majority of systems (desktops+notebooks) are dual core or 2 cores+HT surely that must make you cringe! Then we have programs that don't make use of multiple cores efficiently &/or the latest instruction sets like AVX. There's just a single web browser, that I know of, which uses the latter on PC! Call it whatever you may or twist it however you like to but this is one of the major reasons that PC sales are declining not just "everyone owns one & so they don't need it" excuse that's thrown around far too often. So far as "extrapolating this article to my observations" argument is concerned, there's no need to do that since there's historical precedence & copious amount of evidence to support pretty much every word of what I've said.Azethoth - Thursday, September 3, 2015 - link
Ugh dude, you have no idea what you are talking about. 4.4 architectures on a phone are a desperate attempt to reduce power usage. I am a programmer and compile times matter to me and threading helps. Even so going from 8 threads on my desktop CPU to 12 threads on the E CPU a year later only reduces a total recompile of 26 minutes by 2-3 minutes. But that E cannot clock as high, so in the regular incremental compile case it is slower. Do you get this? You are factually wrong for an actual core dependent use case.Now I can stick my head in the sand like you and pretend that more cores are automatically better but it just isn't for my workload. You may as well bitch that I should be running on multi thousand dollar server CPUs with 16 cores. Again no. They have their place in a server, but no place in my desktop.
Samus - Tuesday, September 1, 2015 - link
If "Google and Android" have 'nailed' MT then why do $600+ Android phones feel more sluggish, have a choppier UI, and launch programs slower than a 3 year old iPhone 5 or Lumia 800?Perhaps because the kernel and underlying architecture are so bloated because they need to support so many SOC's. They've resorted to heavy compression just to keep distribution sizes down, which also hits performance.
Android only has one place, on cheap phones. You're an idiot if you buy a $600+ Android phone when you get the same crappy experience on a $50 Kyocera.
I've tried so hard to like Android over the years, but every device I've had completely disappointed me compared to older Blackberry and modern iPhone devices where you don't need to find hacked distributions when manufactures drop the ball supporting the phone, or just make a crappy ROM in general. Even Nexus devices aren't immune to this and historically they haven't been very good phones, although admittedly, the only high-end Android phone worth buying is a Nexus, but now they cost so much it isn't justifiable.
Basically I recommend two phones to people. If they want a cheap phone, get a OnePlus One or some other sub-$300 Android device. If you're budget is higher, get an iPhone, or if you are adventurous, a WinMo device. At least the iPhone will receive support for 4-5 years and holds its value during that time.
Buk Lau - Tuesday, September 1, 2015 - link
I'm calling BS on most of your claims. Your experience with a Moto E (not saying it's a bad phone) will be vastly different from that of a Note 5, and those differences can start as obvious as how often you need to refresh your Chrome pages as you run out of RAM.What "600+" Android phone are you talking about that feels “more sluggish and slower” than a 3 year old iPhone? If you want people to take your claim seriously then at least provide some examples rather than this generic BS that anyone can easily come up with.
The way Android is designed makes it kind of difficult to bring updates as surprising as you may found. Every time the OS updates, there are changes to the HAL (hardware abstraction layer) and those changes can be minor or significant. It is then up to the SoC provider to provide the proper drivers needed after the HAL change, and they certainly won’t provide it for free. At the same time, OEM also have to decide how much the new update will impede performance. For example my first gen Moto X got an update to 5.1.1 a few months ago and despite the new features, there are still performance hits in places. Even older devices probably will do better on Jelly Bean and KitKat anyways since Google Play services can be updated independent of OS version.
Here’s some useful info on why Android is as fragmented as it is
http://www.xda-developers.com/opinion-android-is-i...
The biggest reason Apple updated all those 4S isn’t because how they loved their users, but rather to purposely slow down their devices to force them to upgrade. You can just ask the 4S users around you to see what iOS 8 really meant for them.
I do agree however that people should try more $300-400 devices that are near flagship level with compromises that are more tolerable, and this $600+ smartphone price should really tone itself down a bit.
Kutark - Tuesday, September 1, 2015 - link
Yeah i have to call bullshit on his claims too. I mean i know its anecdotal, but my buddies and i have had literally dozens of android phones over the years, as well as various iphones. And none of us have seen any kind of performance difference between the two. Im thinking he just had a shit experience with one android phone and like most people just wrote it off at that point.I have had a bad experience with an HTC Rezound, but every phone ive had before or after that has been fantastic. I absolutely LOVE my LG G3, its extremely responsive and fast, and i've never had issues with slowdowns on it. That being said i dont do any "gaming" (and i put gaming in quotes for a reason) on the phone, so i can't speak to that. But as far as browser, youtube, other apps, etc. It couldn't be more perfect.
Samus - Wednesday, September 2, 2015 - link
I'm at IT director and I have a "shit experience" with android phones people bring to me every week.Defending android is like defending your Kia Rio. It's a low cost tool to fit a low cost niche. The experience is the same no matter who is driving.
Kutark - Wednesday, September 2, 2015 - link
If you say so. As an IT director you should know that 99% of the time there is a problem, its user related and not hardware related. One thing i will give apple is that they lock their products down so hard that its much harder for the user to F it up. Whereas on more open platforms like android or windows, the user has much more control and thus much more ability to F things up royally.Whether thats a plus or a minus really just depends on what you're looking for. For people who want or need control over their hardware, its a plus, for people who just want something "to work" so to speak, its a minus.
mkozakewich - Wednesday, September 2, 2015 - link
Your claim that Apple is trying to slow down devices throws off your entire argument, really.