Transcend ESD310C Dual-Interface UFD Review: Silicon Motion Powers Portable SSD in a Thumb Drive
by Ganesh T S on June 22, 2023 8:00 AM ESTPerformance Benchmarks
Benchmarks such as ATTO and CrystalDiskMark help provide a quick look at the performance of the direct-attached storage device. The results translate to the instantaneous performance numbers that consumers can expect for specific workloads, but do not account for changes in behavior when the unit is subject to long-term conditioning and/or thermal throttling. Yet another use of these synthetic benchmarks is the ability to gather information regarding support for specific storage device features that affect performance.
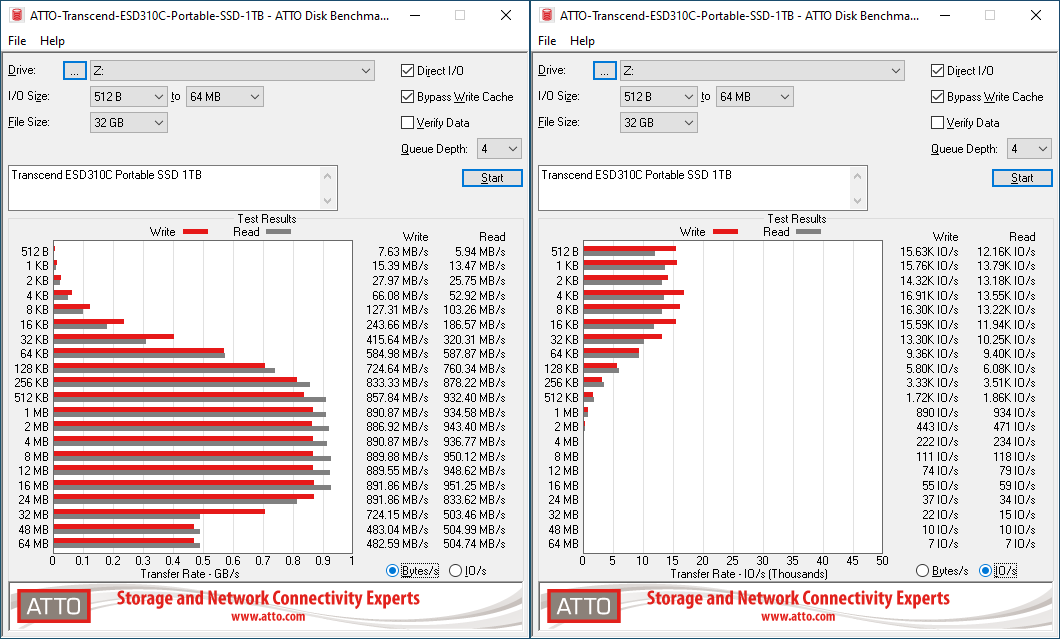
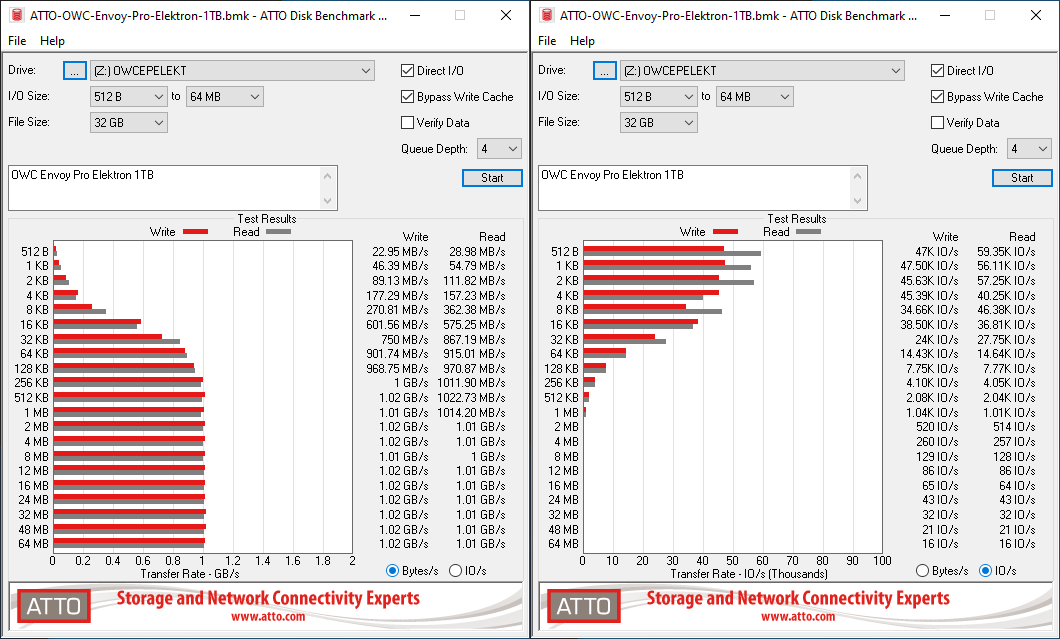
Transcend claims read and write speeds of 1050 MBps and 950 MBps respectively. While these numbers are not hit with our ATTO benchmark settings (bypassing the write cache and using a queue depth of 4 for sequential accesses), we find that the writes are faster than a similarly built Kingston DataTraveler MAX A, with read performance being almost the same. In any case, ATTO benchmarking is restricted to a single configuration in terms of queue depth, and is only representative of a small sub-set of real-world workloads. It does allow the visualization of change in transfer rates as the I/O size changes, with optimal performance being reached around 512 KB for a queue depth of 4.
| ATTO Benchmarks | |
| TOP: | BOTTOM: |
 |
|
 |
|
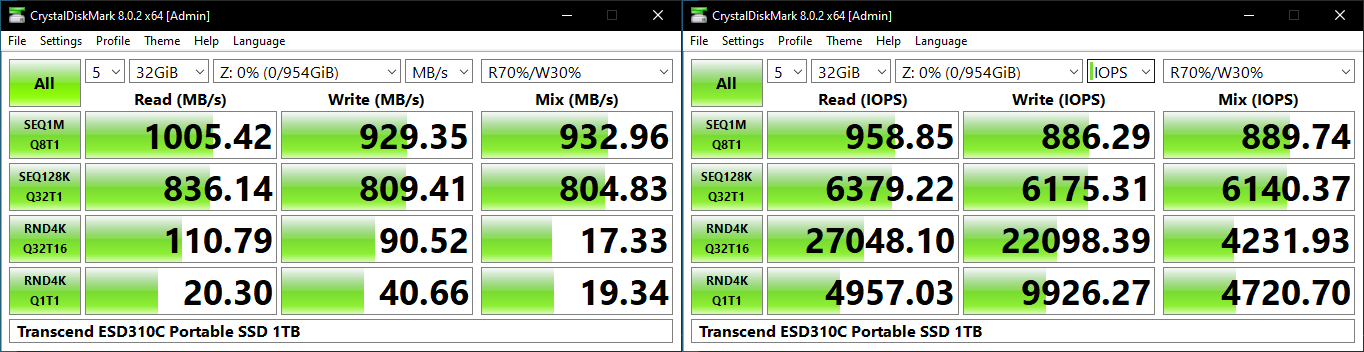
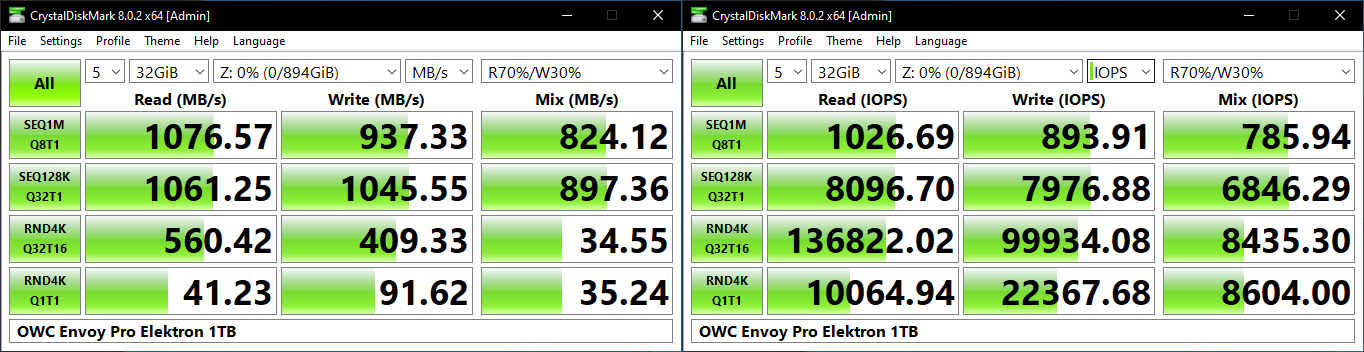
Our CrystalDiskMark benchmark configuration uses four different access traces for reads and writes over a configurable region size. Two of the traces are sequential accesses, while two are 4K random accesses. Internally, CrystalDiskMark uses the Microsoft DiskSpd storage testing tool. The 'Seq128K Q32T1' sequential traces use 128K block size with a queue depth of 32 from a single thread, while the '4K Q32T16' one does random 4K accesses with the same queue configuration, but from multiple threads. The 'Seq1M' traces use a 1MiB block size. The plain 'Rnd4K' one uses only a single queue and single thread . Comparing the '4K Q32T16' and '4K Q1T1' numbers can quickly tell us whether the storage device supports NCQ (native command queuing) / UASP (USB-attached SCSI protocol). If the numbers for the two access traces are in the same ballpark, NCQ / UASP is not supported. This assumes that the host port / drivers on the PC support UASP.
| CrystalDiskMark Benchmarks | |
| TOP: | BOTTOM: |
 |
|
 |
|
The numbers here are much closer to Transcend's advertised claims. For a queue depth of 8, the reads cross the 1000 MBps barrier, and the writes are near the 950 MBps mark. However, as queue depth increases further, the benefits diminish. The increase in random IOPS with queue depth shows that both UASP and NCQ are supported, as indicated in the CrystalDiskInfo report. On a comparative basis, the performance comes up a bit short against the Kingston DTMAX A. The firmware is perhaps configured differently, and is an aspect that we will continue to focus in the other subsections of the review.
AnandTech DAS Suite - Benchmarking for Performance Consistency
Our testing methodology for storage bridges / direct-attached storage units takes into consideration the usual use-case for such devices. The most common usage scenario is transfer of large amounts of photos and videos to and from the unit. Other usage scenarios include the use of the unit as a download or install location for games and importing files directly from it into a multimedia editing program such as Adobe Photoshop. Some users may even opt to boot an OS off an external storage device.
The AnandTech DAS Suite tackles the first use-case. The evaluation involves processing five different workloads:
- AV: Multimedia content with audio and video files totaling 24.03 GB over 1263 files in 109 sub-folders
- Home: Photos and document files totaling 18.86 GB over 7627 files in 382 sub-folders
- BR: Blu-ray folder structure totaling 23.09 GB over 111 files in 10 sub-folders
- ISOs: OS installation files (ISOs) totaling 28.61 GB over 4 files in one folder
- Disk-to-Disk: Addition of 223.32 GB spread over 171 files in 29 sub-folders to the above four workloads (total of 317.91 GB over 9176 files in 535 sub-folders)
Except for the 'Disk-to-Disk' workload, each data set is first placed in a 29GB RAM drive, and a robocopy command is issue to transfer it to the external storage unit (formatted in exFAT for flash-based units, and NTFS for HDD-based units).
robocopy /NP /MIR /NFL /J /NDL /MT:32 $SRC_PATH $DEST_PATH
Upon completion of the transfer (write test), the contents from the unit are read back into the RAM drive (read test) after a 10 second idling interval. This process is repeated three times for each workload. Read and write speeds, as well as the time taken to complete each pass are recorded. Whenever possible, the temperature of the external storage device is recorded during the idling intervals. Bandwidth for each data set is computed as the average of all three passes.
The 'Disk-to-Disk' workload involves a similar process, but with one iteration only. The data is copied to the external unit from the CPU-attached NVMe drive, and then copied back to the internal drive. It does include more amount of continuous data transfer in a single direction, as data that doesn't fit in the RAM drive is also part of the workload set.
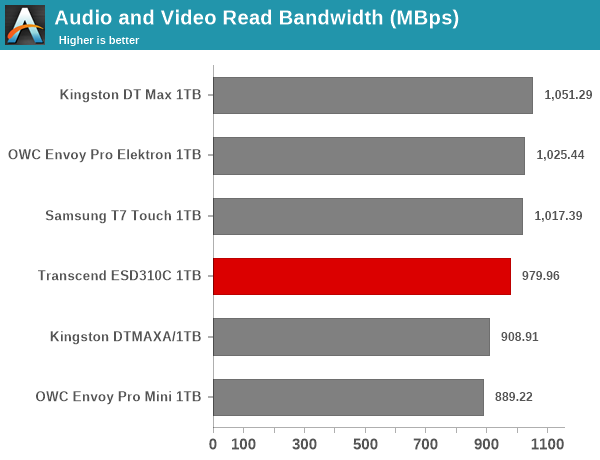
The Transcend ESD310C comes in the middle of the pack in most benchmark components here. The main comparison is against the Kingston DTMAX A. Interestingly, the Kingston UFD starts off with a healthy lead, but in the later benchmarks, the ESD310C wrests a slight advantage. For all practical purposes, the casual user will notice no difference between them in the course of normal usage. However, power users may want to dig deeper to understand the limits of each device. To address this concern, we also instrumented our evaluation scheme for determining performance consistency.
Performance Consistency
Aspects influencing the performance consistency include SLC caching and thermal throttling / firmware caps on access rates to avoid overheating. This is important for power users, as the last thing that they want to see when copying over 100s of GB of data is the transfer rate going down to USB 2.0 speeds.
In addition to tracking the instantaneous read and write speeds of the DAS when processing the AnandTech DAS Suite, the temperature of the drive was also recorded. In earlier reviews, we used to track the temperature all through. However, we have observed that SMART read-outs for the temperature in NVMe SSDs using USB 3.2 Gen 2 bridge chips end up negatively affecting the actual transfer rates. To avoid this problem, we have restricted ourselves to recording the temperature only during the idling intervals. The graphs below present the recorded data.
| AnandTech DAS Suite - Performance Consistency | |
| TOP: | BOTTOM: |
 |
|
 |
|
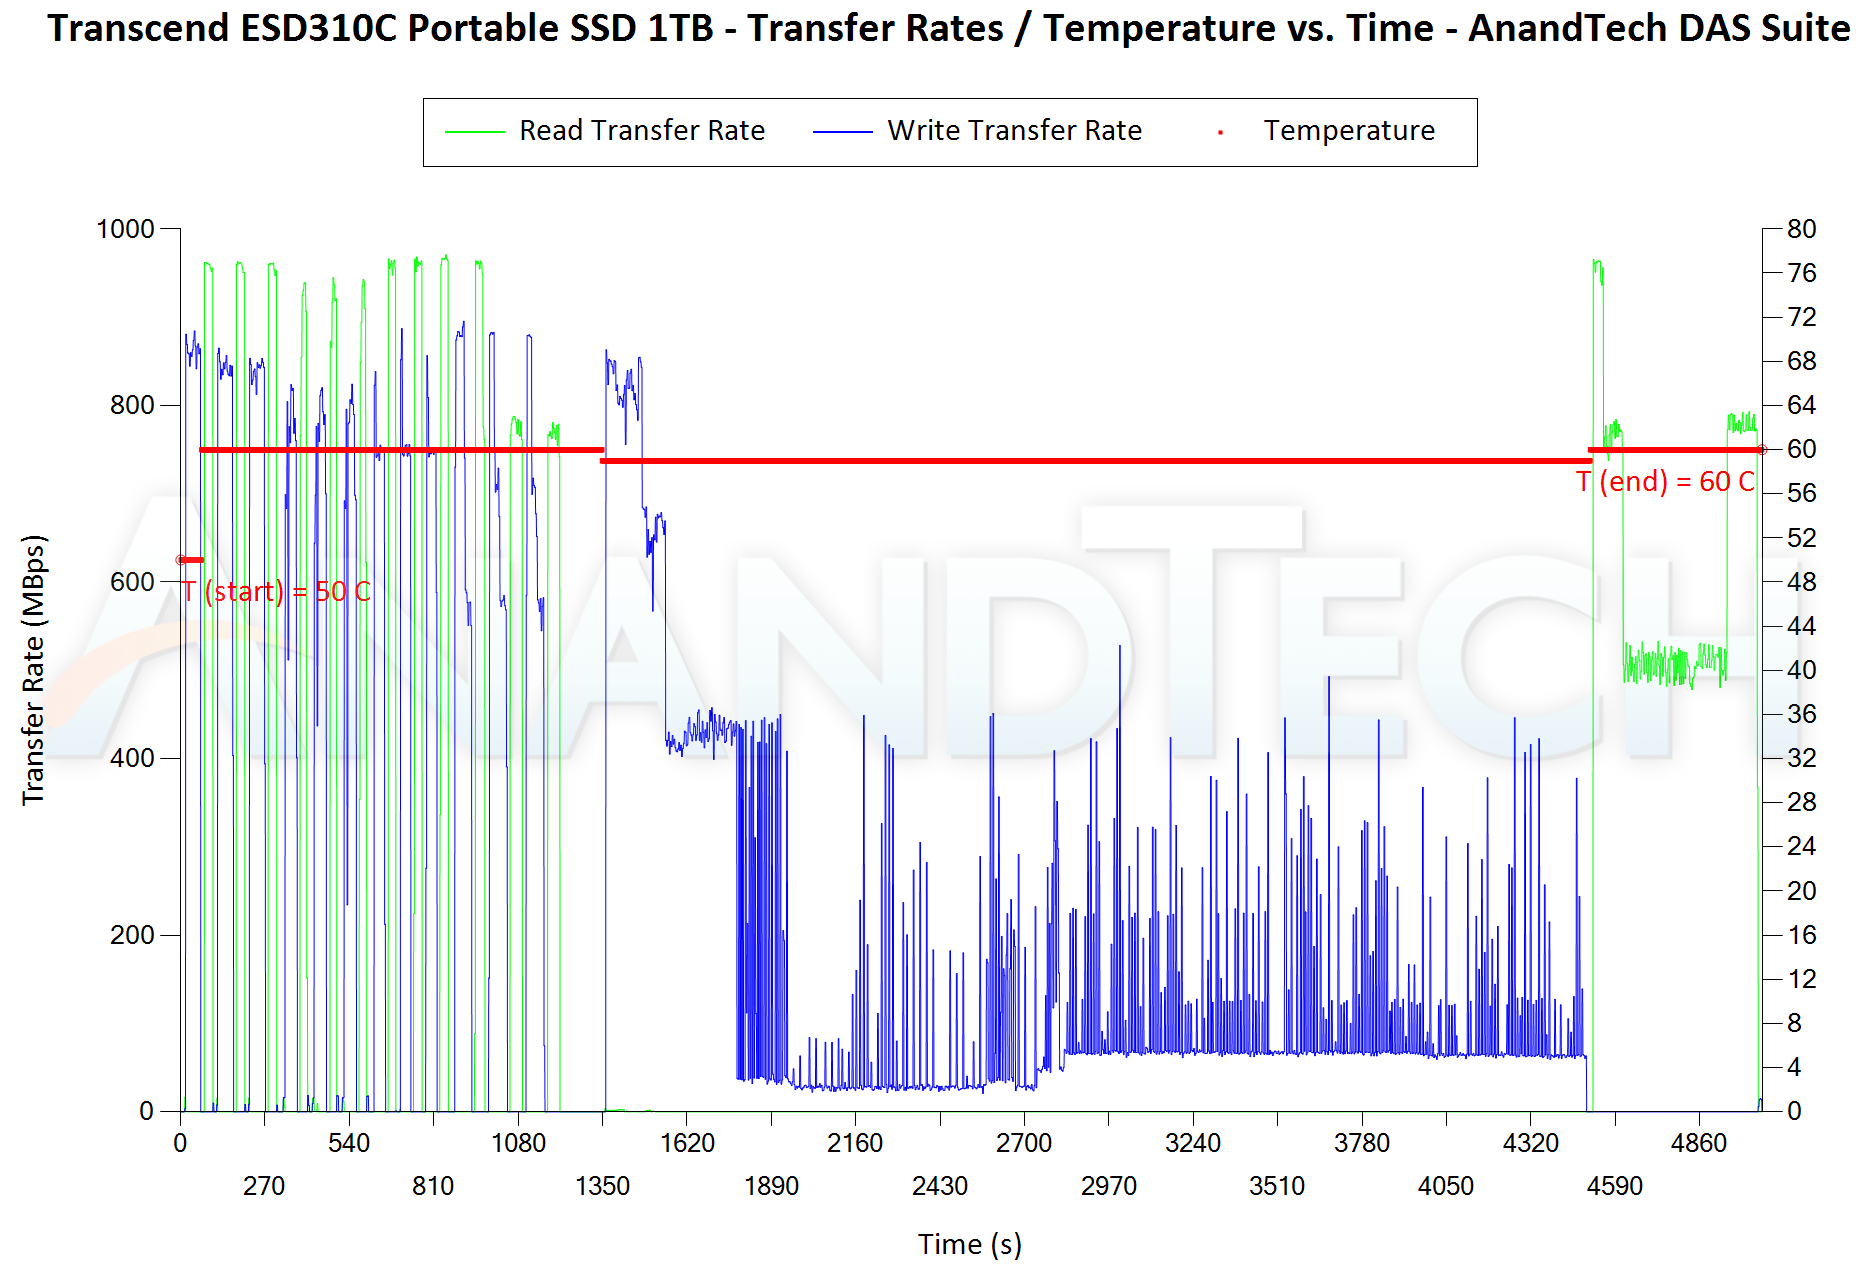
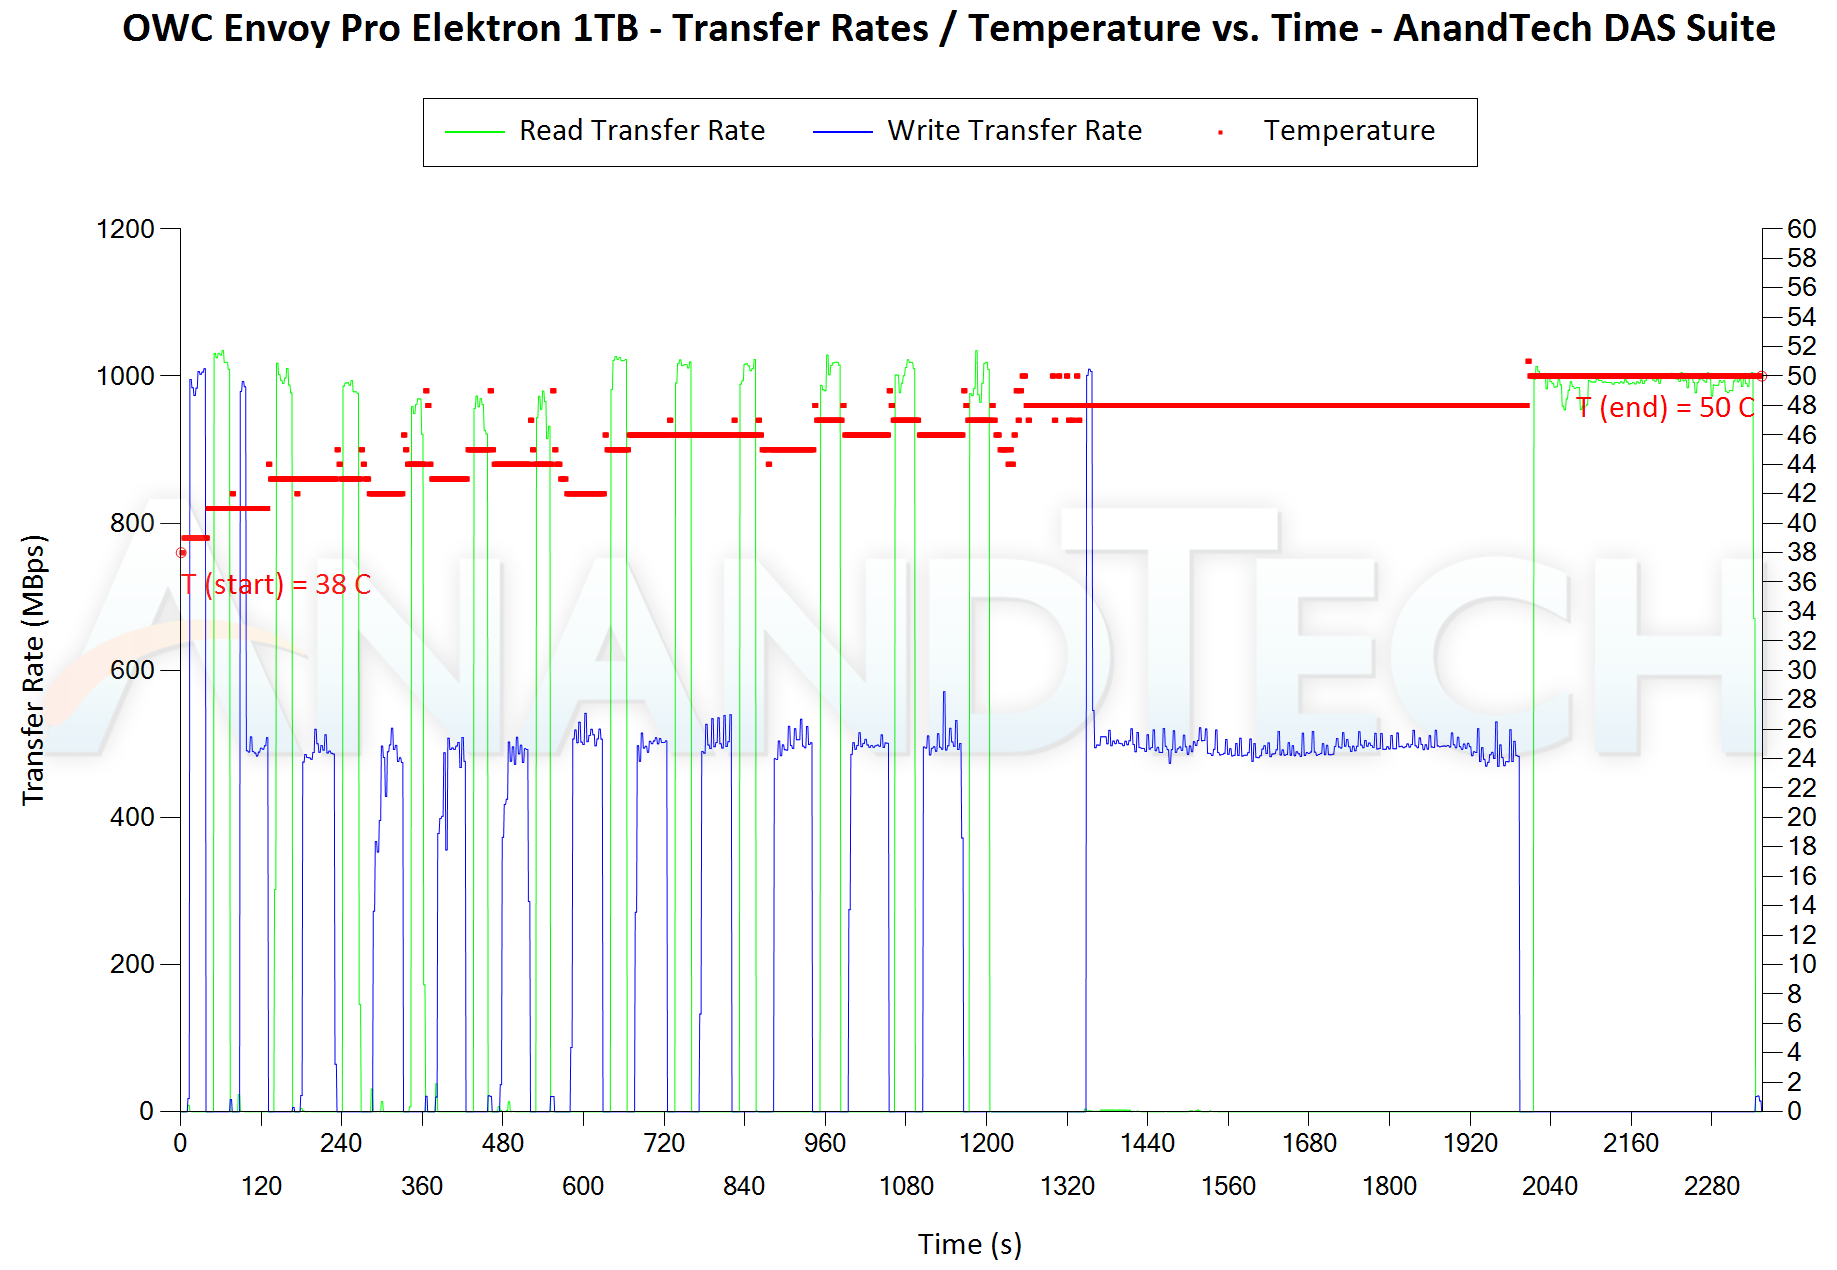
The first three sets of writes and reads correspond to the AV suite. A small gap (for the transfer of the video suite from the internal SSD to the RAM drive) is followed by three sets for the Home suite. Another small RAM-drive transfer gap is followed by three sets for the Blu-ray folder. This is followed up with the large-sized ISO files set. Finally, we have the single disk-to-disk transfer set. Given that the internal components are the same, the main comparison is against the Kingston DTMAX A. The firmware configuration in the ESD310C seems to impose a hard cap of 60C for the temperature and throttles speeds in order to keep the UFD within that envelop. Peak write speeds are higher for the ESD310C in the initial stages, but thermal throttling soon causes even read speeds to drop to around 750 MBps. Meanwhile, without a thermal cap, the DTMAX A remains at 1 GBps reads. The net result is that despite the higher initial write speeds, the ESD310C's desire to not exceed 60C slows down the drive under extended use. Under additional stress, the lack of thermal throttling in the DTMAX A catches up with its performance. When transferring 100s of GBs in one-shot in the disk-to-disk segment, the write speeds drop down to USB 2.0 speeds. On the other hand, the ESD310C manages to complete the write segment of the disk-to-disk test faster. When moving to the read segment, thermal throttling again affects the ESD310C (dropping down to 500 MBps for an extended duration), while the DTMAX A can maintain speeds between 850 MBps and 1000 MBps.
PCMark 10 Storage Bench - Real-World Access Traces
There are a number of storage benchmarks that can subject a device to artificial access traces by varying the mix of reads and writes, the access block sizes, and the queue depth / number of outstanding data requests. We saw results from two popular ones - ATTO, and CrystalDiskMark - in a previous section. More serious benchmarks, however, actually replicate access traces from real-world workloads to determine the suitability of a particular device for a particular workload. Real-world access traces may be used for simulating the behavior of computing activities that are limited by storage performance. Examples include booting an operating system or loading a particular game from the disk.
PCMark 10's storage bench (introduced in v2.1.2153) includes four storage benchmarks that use relevant real-world traces from popular applications and common tasks to fully test the performance of the latest modern drives:
- The Full System Drive Benchmark uses a wide-ranging set of real-world traces from popular applications and common tasks to fully test the performance of the fastest modern drives. It involves a total of 204 GB of write traffic.
- The Quick System Drive Benchmark is a shorter test with a smaller set of less demanding real-world traces. It subjects the device to 23 GB of writes.
- The Data Drive Benchmark is designed to test drives that are used for storing files rather than applications. These typically include NAS drives, USB sticks, memory cards, and other external storage devices. The device is subjected to 15 GB of writes.
- The Drive Performance Consistency Test is a long-running and extremely demanding test with a heavy, continuous load for expert users. In-depth reporting shows how the performance of the drive varies under different conditions. This writes more than 23 TB of data to the drive.
Despite the data drive benchmark appearing most suitable for testing direct-attached storage, we opt to run the full system drive benchmark as part of our evaluation flow. Many of us use portable flash drives as boot drives and storage for Steam games. These types of use-cases are addressed only in the full system drive benchmark.
The Full System Drive Benchmark comprises of 23 different traces. For the purpose of presenting results, we classify them under five different categories:
- Boot: Replay of storage access trace recorded while booting Windows 10
- Creative: Replay of storage access traces recorded during the start up and usage of Adobe applications such as Acrobat, After Effects, Illustrator, Premiere Pro, Lightroom, and Photoshop.
- Office: Replay of storage access traces recorded during the usage of Microsoft Office applications such as Excel and Powerpoint.
- Gaming: Replay of storage access traces recorded during the start up of games such as Battlefield V, Call of Duty Black Ops 4, and Overwatch.
- File Transfers: Replay of storage access traces (Write-Only, Read-Write, and Read-Only) recorded during the transfer of data such as ISOs and photographs.
PCMark 10 also generates an overall score, bandwidth, and average latency number for quick comparison of different drives. The sub-sections in the rest of the page reference the access traces specified in the PCMark 10 Technical Guide.
Booting Windows 10
The read-write bandwidth recorded for each drive in the boo access trace is presented below.
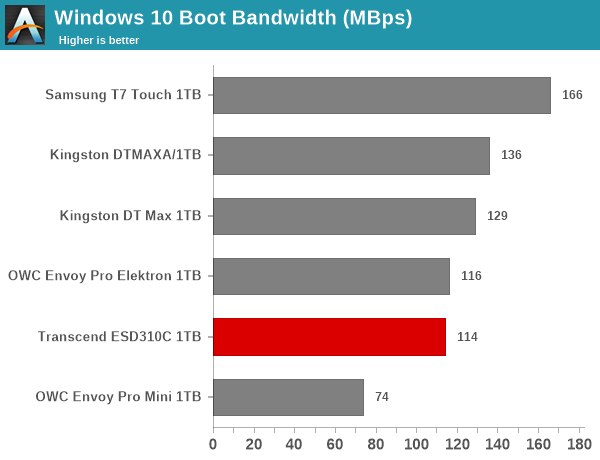
Being read-intensive, the ESD310C manages to perform as well as NVMe-USB bridge-based PSSDs in the OS boot scenario.
Creative Workloads
The read-write bandwidth recorded for each drive in the sacr, saft, sill, spre, slig, sps, aft, exc, ill, ind, psh, and psl access traces are presented below.
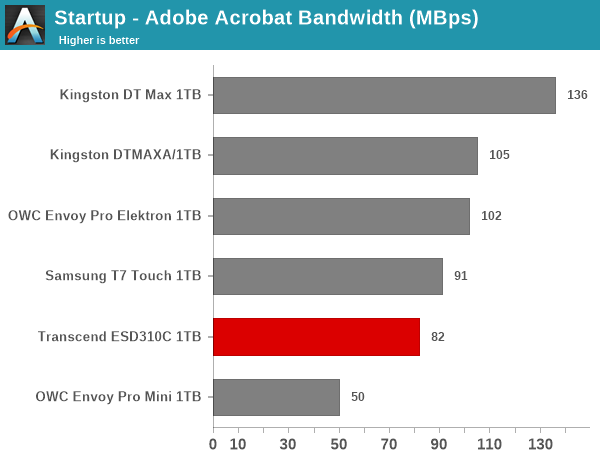
Creative workloads involve a mixture of reads and writes, and bridge-based solutions offer better performance for such scenarios. On the other hand, the thermal cap probably results in the ESD310C perform slightly worse than the DTMAX A. However, it still enjoys a significant lead over the Phison-based OWC Envoy Pro Mini.
Office Workloads
The read-write bandwidth recorded for each drive in the exc and pow access traces are presented below.
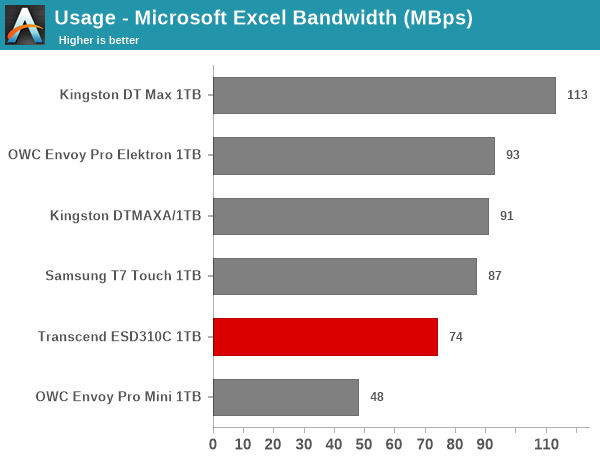
The performance in office workloads is similar to what was seen in the creative workloads set. The bridge-based solutions perform better than the native UFD controller-based PSSDs. Within the Silicon Motion-based set, the ESD310C makes up the rear of the pack, but is still better than the Phison solution in the OWC Envoy Pro Mini.
Gaming Workloads
The read-write bandwidth recorded for each drive in the bf, cod, and ow access traces are presented below.
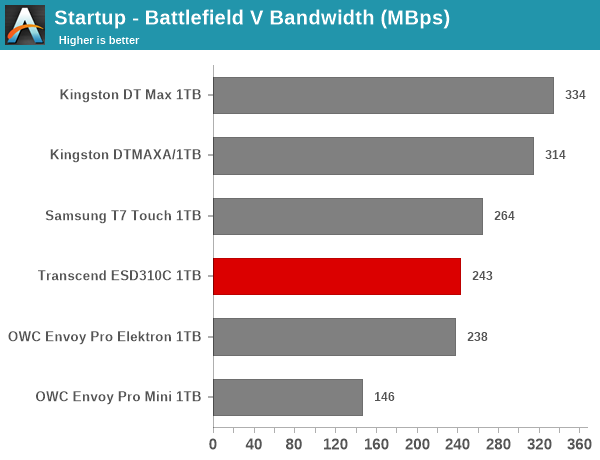
Gaming workloads are read-intensive and right up the alley of native UFD controllers. The thermal cap acts as a bit of a downer, but the ESD310C manages to sneak in towards the middle of the pack in all three components.
Files Transfer Workloads
The read-write bandwidth recorded for each drive in the cp1, cp2, cp3, cps1, cps2, and cps3 access traces are presented below.
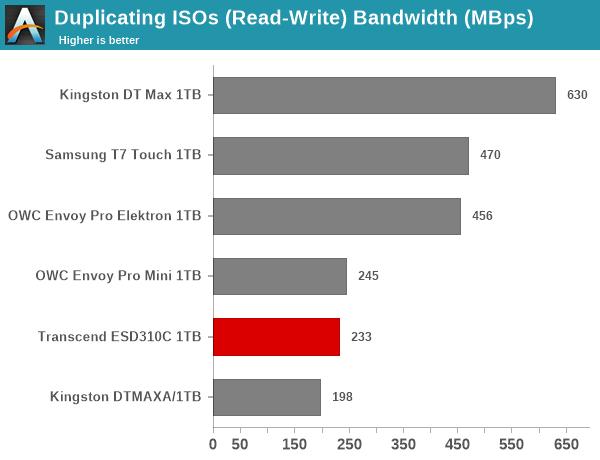
The behavior seen in the creative and office workloads is repeated here - the SM2320 solutions are better off compared to the Phison solution, but the bridge-based ones perform better than the ESD310C handicapped by the thermal cap.
Overall Scores
PCMark 10 reports an overall score based on the observed bandwidth and access times for the full workload set. The score, bandwidth, and average access latency for each of the drives are presented below.
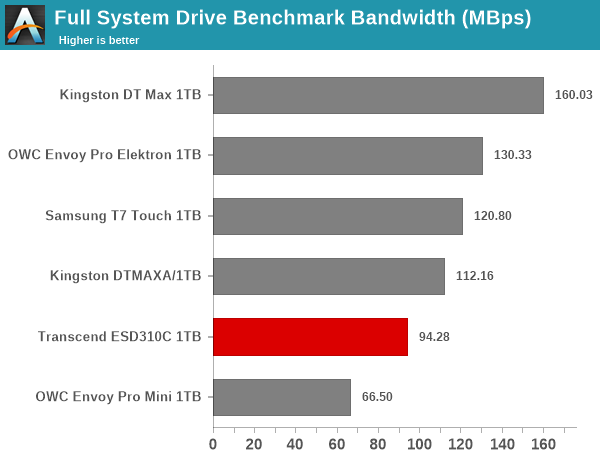
Almost all of the PCMark 10 storage workloads saw the ESD310C emerging as an also-ran when compared with other SM2320-based UFDs. However, it does perform better than the Phison-based UFD, and that is reflected in the overall score. The overall bandwidth and latency are presented in the graphs above.


27 Comments
View All Comments
nandnandnand - Thursday, June 22, 2023 - link
For the first time ever I have USB-C ports on my desktop and phone that I might actually want to use. 1 TB for $69 MSRP seems reasonable for this, and I think the 85 GB buffer is probably fine for me.Samus - Thursday, June 22, 2023 - link
I agree. For the price this certainly fits the "good enough" category. Once I write most of my tools and images, I would rarely be changing more than 85GB at one time. The catch is for it to flush the buffer to TLC the drive has to remain connected and the algorithm has to determine a idle state phase to process that flush in the background. It's unusual for my to connect a USB flash drive and just 'leave it there' for an extended period of time.iAPX - Monday, June 26, 2023 - link
Price Point at that capacity (1TB and 2TB later on), correct read speed, with the 80GB+ limitation on continuous writing at correct speed.I see many usages for this dual-USB key where it would be less expensive and more performing than what I actually use, wether my slow USB Keys or 2.5-inch hard drives.
This products is exciting for me!
PeachNCream - Thursday, June 22, 2023 - link
"...other vendors have tried to differentiate themselves from the Kingston drive..."Is that insider knowledge or just fluff text filler gone wrong? As a writer I would be VERY careful about supporting that with something from at least Transcend and as an editor I would have revised the article to avoid a claim like that.
ganeshts - Thursday, June 22, 2023 - link
I do not see where insider knowledge comes into the picture here. The statement is one that I made as a market observer.Kingston was the first to introduce a high-capacity (1 TB) thumb drive. Now, other vendors like Transcend and OWC are trying to produce 1 TB thumb drives. If they have to present themselves as credible alternatives, it is clear that they need to differentiate themselves from the existing Kingston drive.
If I were working at Transcend or OWC, as a competitive analyst, I would work towards creating a thumb drive that addresses the shortcomings of the Kingston drive. In this case, there are two obvious low-hanging fruits. The Kingston drive, with its plastic construction is flimsy. It also has separate SKUs for Type-A and Type-C. Products such as the Transcend ESD310C and the OWC Envoy Pro Mini address these aspects.
PeachNCream - Thursday, June 22, 2023 - link
Okay, well that does at least confirm that it was an assumption rather than a manufacturer's explicit statement. As I said, I wouldn't venture out on that proverbial limb as a writer, but I don't think anything dreadful will come of it since the product is a low-cost thumb drive and the place of publication is a small tech review site. And it's already been stated a few times that AT does not have editorial review so, well, here we are.Skeptical123 - Saturday, June 24, 2023 - link
The wording is clear and to call it an "assumption" is wrong.GreenReaper - Sunday, June 25, 2023 - link
It is a presumption, but an educated one as this is his beat and he knows how product design and marketing works. Reviews contain both hard facts and analysis, which is a form of opinion. It is not the same as Wikipedia, which requires citations for each assertion - rather, it is a work which might itself be cited, based on the authority of the source and/or the author.PeachNCream - Wednesday, June 28, 2023 - link
Anandtech is an afterthought site with little insider knowledge or access to information that anyone with a search engine can't get themselves. Companies hocking products barely provide free junkware like thumb drives because the site gets so very little attention which I can support with evidence:https://trends.google.com/trends/explore?date=all&...
There's an interesting downward spiral over time and the site has done little to innovate and a lot to clutter itself up with ads including a CPU buying video that's been out of date for ages.
Future PLC puts their loot into Tom's Hardware because it gets about eight times more traffic (also supported with evidence)
https://www.semrush.com/website/anandtech.com/over...
So no, a journalist here isn't any more credible than most of the people posting comments and some of the comments box's declining participant numbers are arguably more informed and better writers even when excusing Anton being an English as a second language writer.
ceisserer - Thursday, June 22, 2023 - link
And just another fast but large usb driver - almost as large as an 2242 ssd in an enclosure.If I plug it into my laptop to expand storage, the usb port will be dead in 6 months - simply because accidents happen.
I am still hoping for a small pen drive with a capable controller, and would be willing to pay a premium - until then even microsd-cards with tiny card readers are a better choice than what most small pen drivers offer.