A Lighter Touch: Exploring CPU Power Scaling On Core i9-13900K and Ryzen 9 7950X
by Gavin Bonshor on January 6, 2023 8:00 AM EST- Posted in
- CPUs
- AMD
- Intel
- 65W
- TDP
- Ryzen 9 7950X
- Core i9-13900K
- Power Scaling
- Efficiency
- 105W
- 125W
- 253W
- 230W
- PPT
Core i9-13900K & Ryzen 9 7950X Scaling Performance: CPU Short Form
For the compute side of our testing to determine how well the Core i9-13900K and Ryzen 9 7950X scale at different power levels, we've opted for a range of CPU-intensive benchmarks, particularly from the rendering and encoding section of our test suite.
To keep the playing field even, we are using the same SK Hynix DDR5-5600B 2 x 16 GB memory kit throughout all of our testing. We've separated the results within the same graph to outlay performance differences at different power levels so that users can see the differences and comparison in performance on offer from both the Core i9-13900K and Ryzen 9 7950X processors.
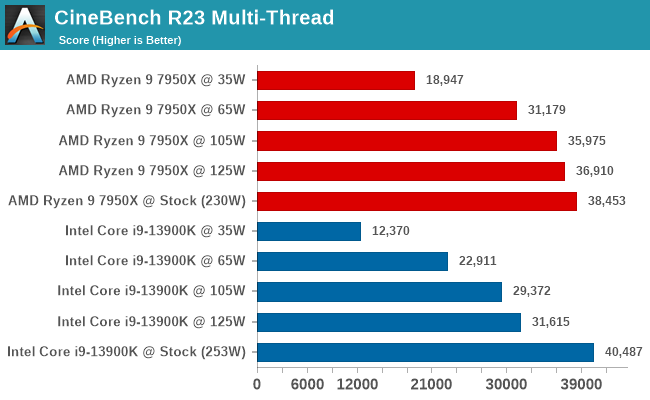
CineBench R23: Single and Multi-Threaded Performance
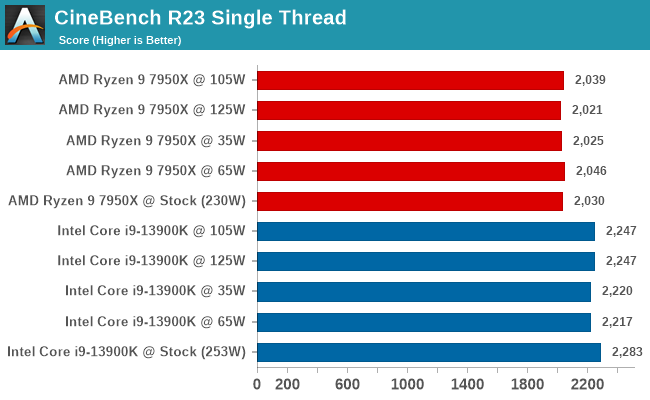
Focusing on performance in CineBench, it is worth highlighting that in the single-threaded test, Intel's Core i9-13900K displayed better single-core performance throughout. It didn't impact single-threaded performance on either processor despite restricting the power levels, which is exactly what we'd expect to find. While highly clocked CPU cores are very expensive from a power perspective, they are not so expensive as to consume the complete power budget of chips such as these.
Looking at multi-threaded performance in CineBench R23, this is where restricting the power levels makes the difference. Although Intel has the best performance in CineBench R23 MT at stock settings, it's AMD that scales better (i.e. loses less performance) as the power is restricted. Even at 65 W, the Ryzen 9 7950X is faster than the Core i9-13900 at 125 W, which is very impressive. Both processors take a massive hit in performance at 35 W, which is to be expected as we're now some 200 Watts below their stock power limits.
C-Ray 1.2: 4K, 16 Rays Per Pixel
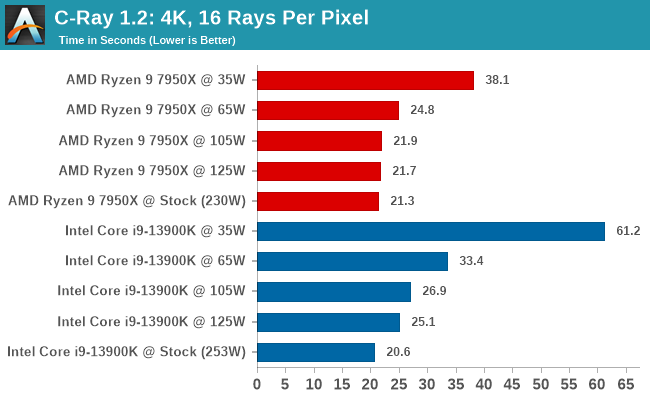
Looking at the results in our C-Ray benchmark, the results between stock settings to 65 W impacted our figures. Starting with the Ryzen 9 7950X, there was a marginal performance loss between stock settings at 125 W and 105 W. Going from stock settings to 65 W (2.5X power), there was a drop in C-Ray performance of around 16%.
Focusing on the Core i9-13900K, its performance was heavily power reliant when comparing stock settings to 125 W, 105 W, and 65 W. Even from stock settings to 125 W, there's a performance loss of around 21%, and even more so comparing stock settings to 65 W, which equates to around 38%.
Things tailed off massively when both set to 35 W, with the AMD Ryzen 9 7950X beating the Intel Core i9-13900K convincingly here.
POV-Ray 3.7.1:
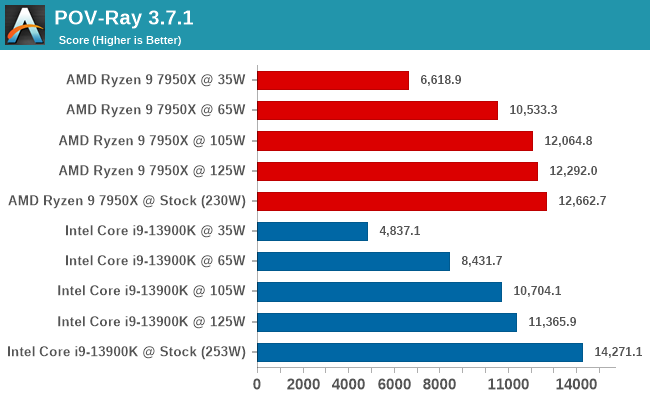
In our POV-Ray benchmark, we saw some interesting behavior. Although the Core i9-13900K at default settings comfortably beat the Ryzen 9 7950X, the 7950X held its performance well when dropping down the power, with the 7950X's result at 65 W being similar to the 13900K at 105 W. This shows that the Ryzen 9 7950X and its 5 nm die is more scalable at lower power.
Blender 3.4: CPU Only Compute
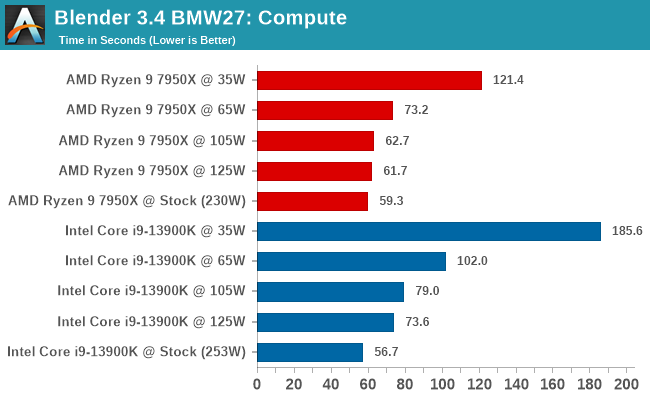
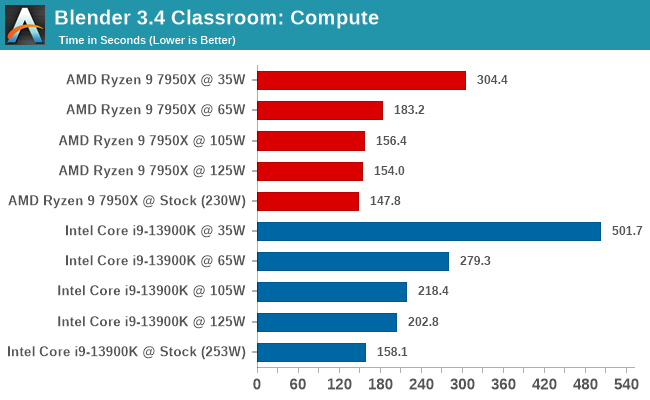
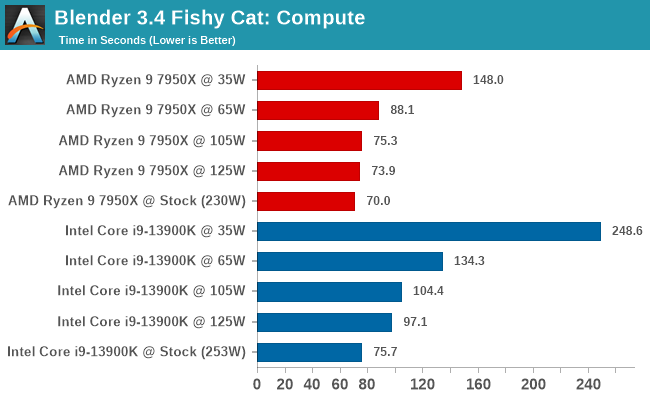
At default settings, the Core i9-13900K and Ryzen 9 7950X was competitive in all of the Blender sub-tests, even when restricting the power. Once power was restricted, we saw that the 7950X held onto much of its performance, while the 13900K didn't fare so well. In the Fishy Cat subtest at 65 W, the 7950X was 62% faster than the 13900K, which is impressive scaling here by AMD.
x264 Encoding: 1080p and 4K Bosphorus
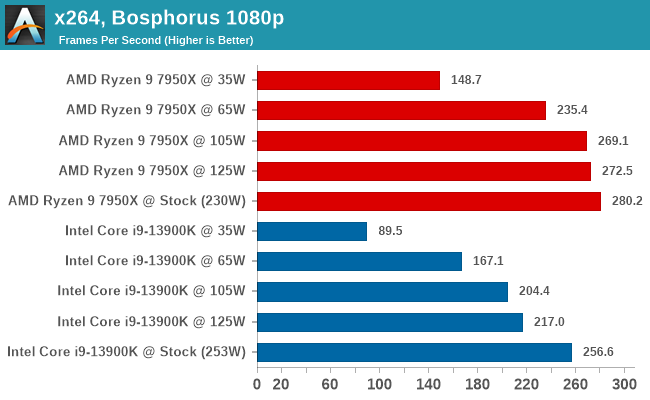
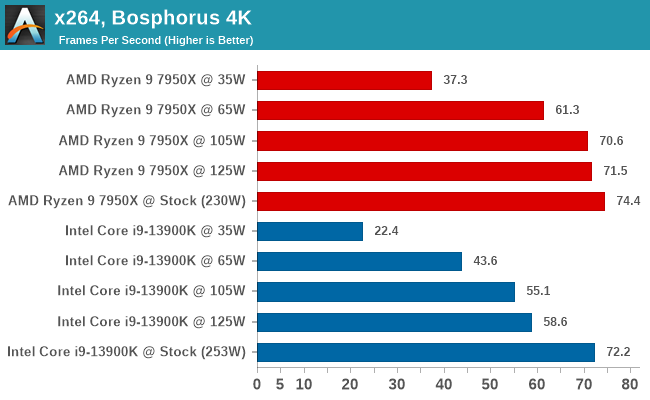
The x264 benchmark focuses on encoding performance, and at default settings, AMD's Ryzen 9 7950X wins out. Even dropping down to 125 W, the 7950X only loses around 2% at 1080p and around 4% at 105 W. At 65 W, the 7950X is around 16% slower than at default settings.
Looking at Intel's Core i9-13900K, the 13900K loses around 15% performance by restricting power to 125 W compared to default settings. This is another example that the 5 nm Zen 4 architecture scales much better at lower power envelopes than Intel's 10 nm refresh; this isn't unexpected, however.


61 Comments
View All Comments
ingwe - Friday, January 6, 2023 - link
Really cool testing. If I had an 7950, I wouldn't be running it higher than 105W. Then again, I have a 5600 and I am running that at 45 W. Feels like the gains these days aren't generally worth the power (for my use cases and especially for AMD). I am surprised by how well Intel's performance scales with power. I would be curious how 12th gen looks since this isn't their first gen with high power consumption they may have done a lot better designing for power scaling.deksman2 - Friday, January 6, 2023 - link
Yeah. I think AMD's sweet spot for Zen 4 should have remained 105W like last gen.They could have introduced 170W for a bit of extra performance... but otherwise make a statement that there was too much in diminishing returns.
7900x and 7950x should probably be run at 105W by default... you get 6.4% less performance at nearly 50% lower power draw (vs 170W), and generally, lower temps.
fybyfyby - Saturday, January 7, 2023 - link
They needed 170/230 target only for compete with Intel. Otherwise it doesn't make sense. I tried all eco modes and I'm perfectly fine with 65w. 105w is identical as my former 5900x wattage - in reality it is peaked around 145w. They needed to max out stock settings, but there is no need to use that for any ordinary user.DanNeely - Monday, January 9, 2023 - link
I'm really disappointed with Intel, AMD, NVidia, and AMD (again); all their current generation products are dragging high end overclocking power levels and resultingly terrible power efficiency into stock performance packages.Hulk - Friday, January 6, 2023 - link
I think you need to include at least one power level between 125W and 230W. That's quite a spread there that has no data that might change your conclusions had you included say 170W and 200W in the data.Also outside of benchmarks many real world applications don't saturate the individual cores enough to demand a lot of power. In these cases performances is more about how high the lightly loaded cores will scale rather than power limiting performance. This is exactly what you saw with the gaming tests and is why real world workloads should have been made before making conclusions.
But then again I'm almost afraid to criticize because I appreciate any new content on Anandtech these days!
repoman27 - Friday, January 6, 2023 - link
"I appreciate any new content on Anandtech these days!"—Amen to that.While I agree that the sampling points chosen make it more difficult to visualize the curve, it clearly starts to bend significantly between 65 and 105 W and has flattened out substantially by the time you hit 125 W. So personally, I'd be much more interested in seeing performance at 80 and 95 W instead, as the best power / performance trade-off is probably somewhere around there. Which, not coincidentally, is also where desktop CPU TDPs traditionally were, before Intel ran into process issues.
@gavbon, peak power is really not relevant to either TDP or power efficiency. And given their myriad differences, comparing temperatures as reported by these two CPUs seems unlikely to yield any meaningful takeaways. I'm not sure how Andrei used to do it, but running SPEC CPU 2017 (a fixed workload) while measuring the energy usage in Joules is pretty much the holy grail as far as efficiency is concerned.
Hresna - Tuesday, January 17, 2023 - link
I agree it would be great to see the curve - I was inspired to plot it myself for 13900k.https://www.reddit.com/r/hardware/comments/10bna5r...
This is essential coverage though, great to see Anandtech adopting this. I would love to see detailed power curves become standard for desktop chips going forward. If I had a 7950x to play with, it would be amazing to have both curves not he same chart. The inflexion points in the bend are sensitive so I might need to make some inferences but could use the Anandtech data as a starting point.
edzieba - Friday, January 6, 2023 - link
It would be interesting to plot benchmark performance vs. /actual/ power consumption rather than /reported/ consumption, as the Y-cruncher results on the last page show that the Ryzen chips are significantly underreporting power consumption vs. Intel (with the 105W capped Ryzen pulling the same power as the 125W-capped Intel). A scatterplot of normalised-per-benchmark scoring vs. measured power should result in a trend per CPU illustrating power scaling behaviour for different workloads.repoman27 - Friday, January 6, 2023 - link
The yCruncher chart shows peak power, which tells us essentially nothing about power consumption. If we knew the average power and duration of the test, we could infer energy usage. Peak power only gives us the magnitude of the largest recorded current spike during the test.Gavin Bonshor - Friday, January 6, 2023 - link
You are not wrong, if I get time over the weekend, I'll add some additional graphs profiling the power usage over one or two of the runs.